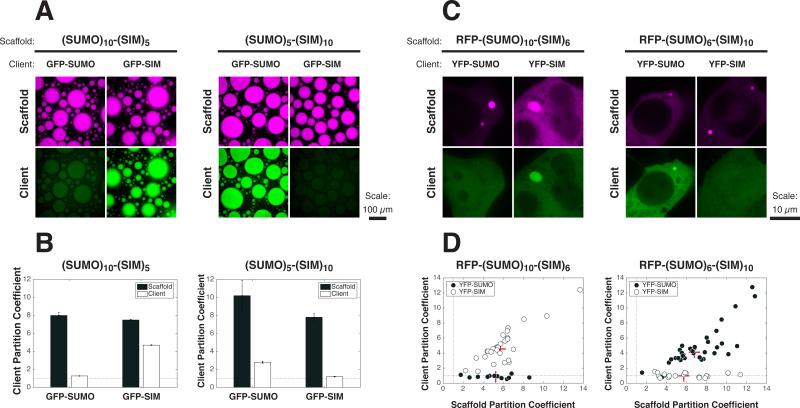
Figure 5. Cellular PolySUMO-PolySIM Puncta Selectively Recruit Low Valency Clients.
(A) 60 nM of GFP-SUMO or GFP-SIM (green) was mixed with 12 μM of (SUMO)10-(SIM)5 (left) or (SUMO)5-(SIM)10 (right) (1% RFP-tagged; magenta), and the resulting droplets were imaged for scaffold and client fluorescence.
(B) PCs for both scaffold (black bars) and clients (white bars) from experiment in (A). Graphs show averages from triplicate experiments. Error bars represent SEM. Dotted line, PC = 1.
(C) Live cell fluorescence images of YFP-SUMO or YFP-SIM (green) co-transfected with RFP-(SUMO)10-(SIM)6 (left) or RFP-(SUMO)6-(SIM)10 (right) (magenta) into HeLa cells.
(D) PCs of scaffolds and client components calculated from cells in the experiment. Each symbol represents the average PC into all puncta (typically 1-3) in a given cell (12-35 cells per sample) when the indicated scaffold was co-transfected with YFP-SUMO (black circles) or YFP-SIM (white circles). Dotted line, PC = 1. Red + sign, median PC.
See also Figure S6.

