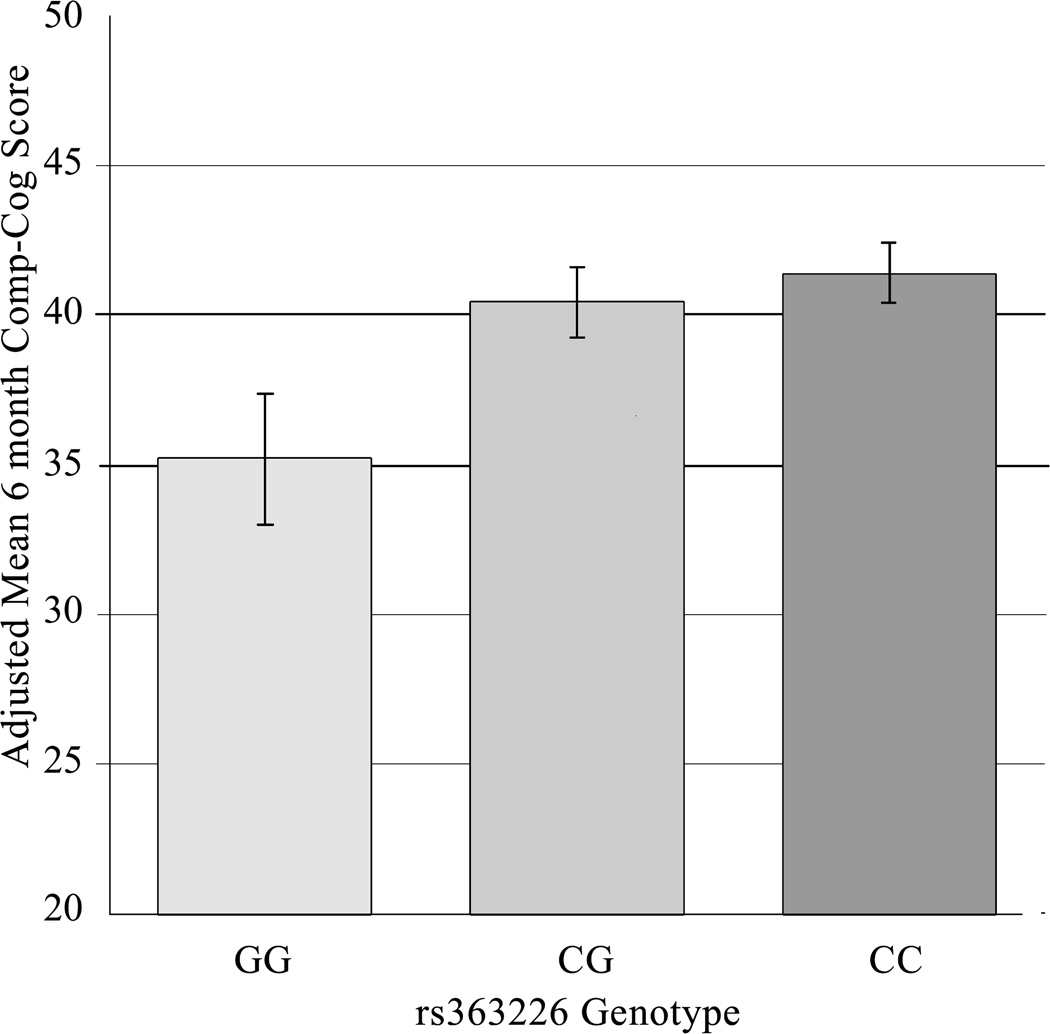
Figure 2. Adjusted Mean 6-Month Comp-Cog Score by rs363226 Genotype.
Adjusted mean Comp-Cog scores are predicted values derived from the regression model (Table 3A), which controls for covariates. Standard error bars are shown. Mean (95% confidence interval) Comp-Cog scores for genotype groups were as follows: GG=35.2 (30.9, 39.5), CG=40.4 (38.1, 42.7), and CC=41.42 (39.4, 43.5). The GG group average was significantly different from the CG (p=0.036) and CC (p=0.012) group averages. CG and CC groups did not significantly differ (p=0.528)

