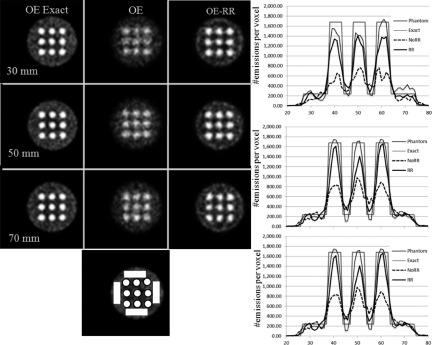
FIG. 5.
Center slice of the reconstructed images and the corresponding profiles of the nine-sphere phantom with warm background reconstructed using the OE and OE-RR algorithms. The first column presents images obtained from the exact data while the second column—from the data affected by resolution uncertainties and reconstructed with the OE without resolution recovery. The third column shows images obtained from the data affected by the resolution uncertainties but reconstructed using the OE-RR algorithm. Three different Compton camera configurations were investigated: with the distance between the scatterer (front detector) and the absorber (back detector) equal to 30 mm (first row), 50 mm (second row), 70 mm (third row). Profiles presented at the right part of the figure (top: 30 mm, middle: 50 mm, and bottom: 70 mm) were drawn horizontally through the three middle spheres. “Phantom” profile line corresponds to the true activity distribution, “Exact” profile was drawn through the images reconstructed from the exact data (i.e., simulated for detectors with perfect energy and spatial resolutions), and NoRR and RR profiles correspond to the data acquired with detectors with limited resolutions and reconstructed without and with resolution recovery option, respectively. The locations of ROI used for calculation of the contrast are shown in the picture displayed below the profiles.

