
Fig. 1.
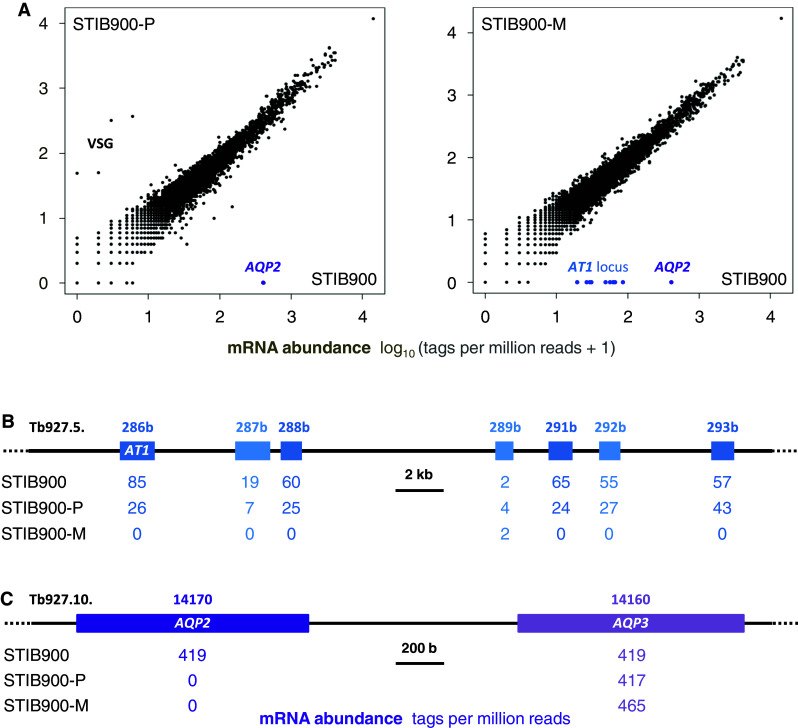
Comparative transcriptomics. a Scatter plots of normalized read counts from RNA sequencing data using the spliced leader trapping protocol. The increment of one allowed logarithmic representation also for genes that had zero sequence tags. Genes that are not expressed in the resistant lines are indicated. Note the VSG switch in STIB900-P. b View of the AT1 locus with read counts per gene. c View of the AQP2/AQP3 tandem locus with read counts per gene