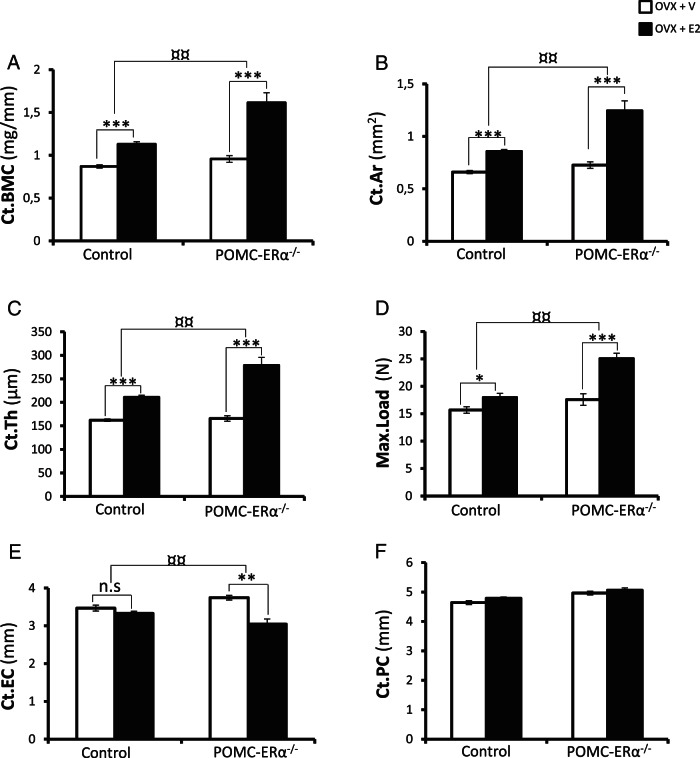
Figure 2.
Enhanced estrogenic responses on cortical bone mass and mechanical strength in POMC-ERα−/− mice. Cortical bone mass and mechanical strength in OVX POMC-ERα−/− and OVX control mice treated with either E2 (0.5 μg/d) or vehicle. A–C, High-resolution μCT analysis of the diaphyseal region of femur (n = 7–10). A, Cortical bone mineral content (Ct.BMC), (B) cortical bone area (Ct.Ar), (C) cortical thickness (Ct.Th), and (D) 3-point bending test of the middiaphyseal region in tibia. The maximal load (Max.Load) at failure is given, (E) cortical endosteal circumference (Ct.EC), and (F) cortical periosteal circumference (Ct.PC) (n = 9–10). Data are presented as mean ± SEM. *, P < .05; **, P < .01; and ***, P < .001 E2 treated vs vehicle treated, Student's t test; ¤¤, P < .01 E2 effect in POMC-ERα−/− mice vs E2-effect in control mice (interaction term from two-way ANOVA).

