Fig. 2.
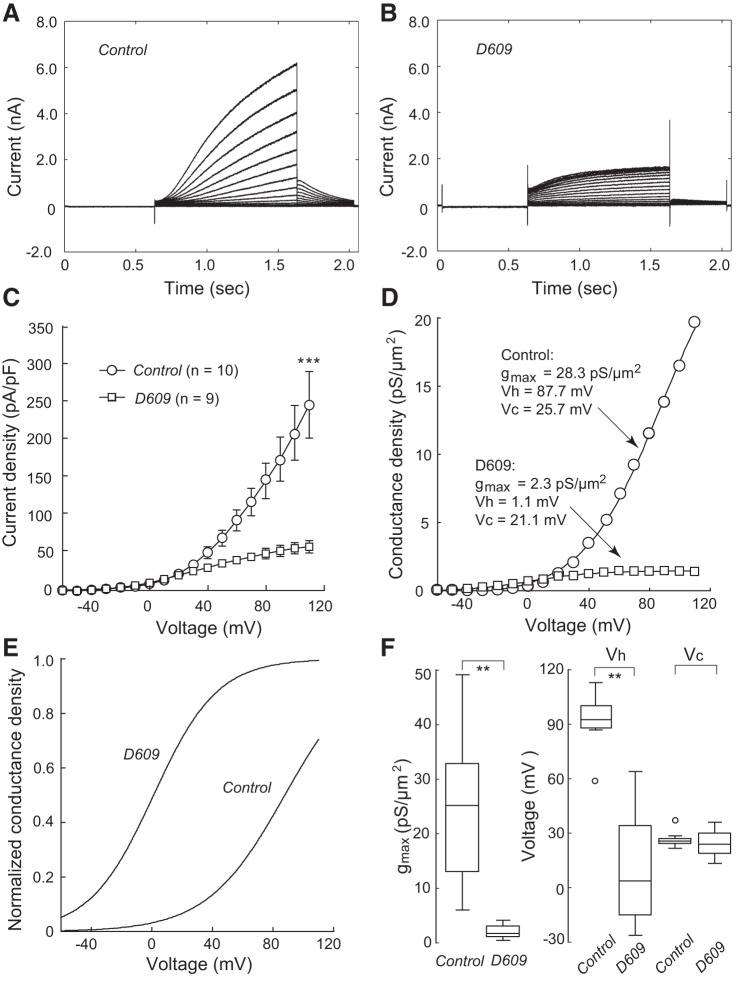
Effect of D609 on KCNQ1/KCNE1 currents. Currents shown here and in all subsequent figures were evoked with the voltage protocol shown in Fig. 1A, inset, except that the highest voltage was increased to 110 mV. A: currents from a cell cultured in control conditions. B: currents from a cell that had received D609 before recording. C: current densities of the control and D609-treated groups. Values are means ± SE. ***P < 0.001. Cell capacitances were 16.2 ± 1.6 and 12.0 ± 2.3 pF for the control and D609 groups, respectively. D: conductance density-voltage relationship in a control cell and a D609-treated cell. Boltzmann fit parameters are shown for each cell. E: Boltzmann fits for the two cells in D are shown with normalized maximum conductance density. D609 induced a marked shift in voltage dependence. F: box plots for maximum conductance density (gmax), half-activation voltage (Vh), and slope factor (Vc); open circles represent outliers. n = 10 (Control) or 9 (D609). **P < 0.01.

