Fig. 5.
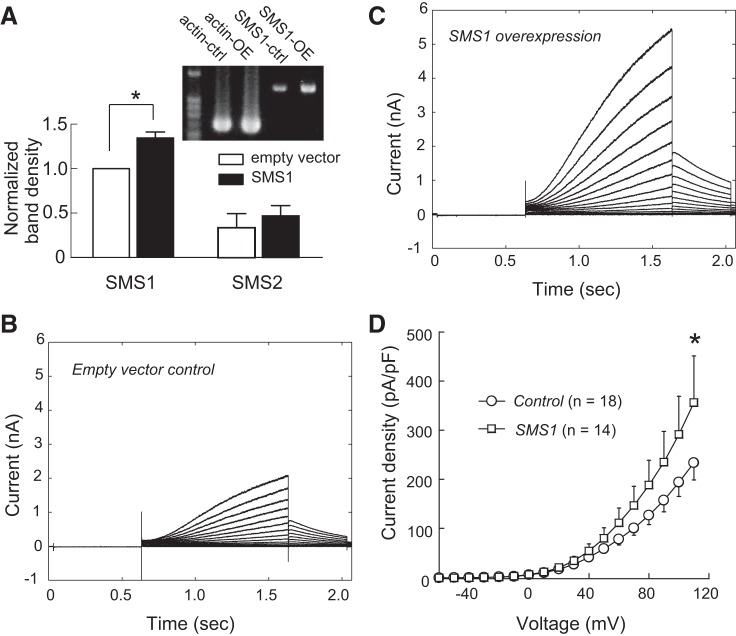
SMS1 overexpression increased KCNQ1/KCNE1 current density. A: effect of SMS1 overexpression on SMS1 and SMS2 mRNA levels. Fluorescence ratios of SMS1 and SMS2 to β-actin cDNA in the control and overexpression groups, normalized to the control for SMS1. Values are means ± SE; n = 6 (SMS1 and SMS2). *P < 0.05. Inset: photograph showing SMS1 and β-actin RT-PCR products in a control sample and an overexpression sample. B: currents from a control cell transfected with the empty vector. C: currents from a cell transfected with SMS1. D: voltage-dependent current density of control and overexpression groups. Values are means ± SE. *P < 0.05. Cell capacitances were 13.9 ± 5.2 and 12.0 ± 0.7 pF for the control and overexpression groups, respectively.

