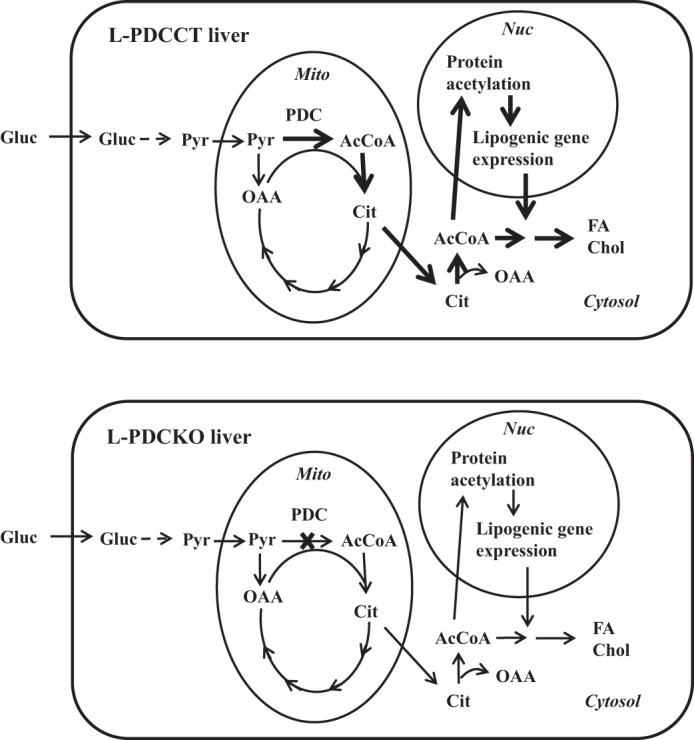
Fig. 7.

Schematic representation of the main cellular reactions involved in the generation and utilization of acetyl-CoA in L-PDCCT and L-PDCKO livers in the fed state. Corresponding arrows in L-PDCCT (top) and L-PDCKO (bottom) indicate carbon flux, protein modification, or gene expression. Thicker arrows in L-PDCCT liver indicate increased carbon flux, protein modification, or gene expression; arrows similar in thickness indicate no change between the 2 livers. Gluc, glucose; Pyr, pyruvate; AcCoA, acetyl-CoA; Cit, citrate; OAA, oxaloacetate; FA, fatty acid; Chol, cholesterol; Nuc, nucleus; Mito, mitochondria; PDC, pyruvate dehydrogenase complex.
