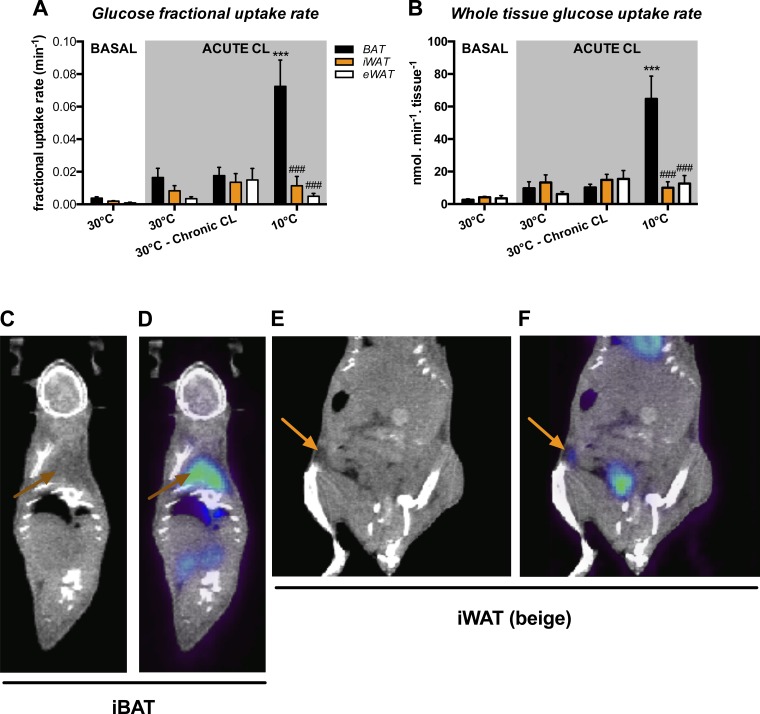
Fig. 2.
Glucose metabolism in various adipose depots. Black bars represent iBAT, orange bars represent iWAT, and open bars represent eWAT [n = 5 mice for 30°C at basal state, n = 4 mice for 30°C and 30°C-chronic CL-316,243 (CL), and n = 5 mice for 10°C following acute CL]. A: fractional glucose uptake determined using the Patlak graphic approach following a 30-min dynamic scan. B: total dynamic glucose uptake corrected for tissue weight. C: representative coronal computed tomography (CT) images. Brown arrows show iBAT region. D: representative positron emission tomography (PET)-CT coregistration following chronic cold exposure. Brown arrows show positive fluoro-[18F]deoxyglucose (18FDG) uptake in iBAT. E: representative coronal CT images. Orange arrows show iWAT region. F: representative PET-CT coregistration following chronic cold exposure. Orange arrows show positive 18FDG uptake in iWAT. Data are expressed as means ± SE. ***P < 0.001 vs. 30°C + acute CL and ###P < 0.001 vs. iBAT, assessed by post hoc Bonferroni test following 2-way ANOVA.

