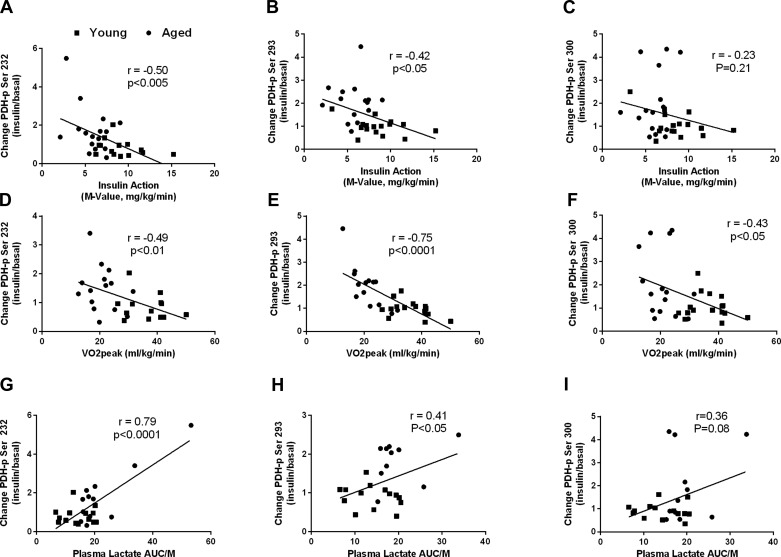
Fig. 5.
Relationships among insulin-stimulated phosphorylation levels of skeletal muscle PDH and whole body and plasma lactate variables. Changes in skeletal muscle PDH Ser232 and whole body insulin sensitivity (A), V̇o2 peak (D), and plasma lactate AUC/insulin action (AUC/M; G). Changes in skeletal muscle PDH Ser293 and whole body insulin sensitivity (B), V̇o2 peak (E), and plasma lactate AUC/M (H). Changes in skeletal muscle PDH Ser300 and whole body insulin sensitivity (C), V̇o2 peak (F), and plasma lactate AUC/M (H). ■, Data points for young individuals; ●, data points for aged individuals.

