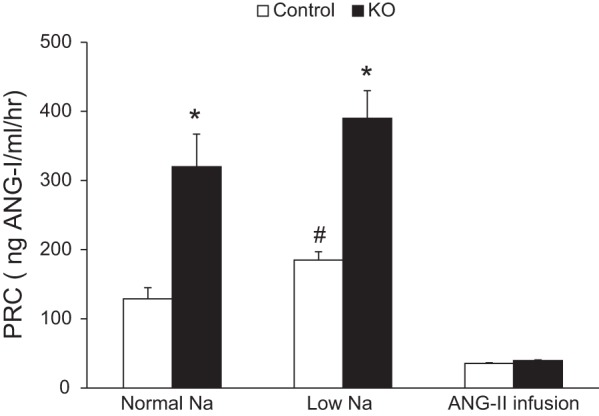
Fig. 7.

Plasma renin concentration (PRC) in control and PRR KO mice on varying Na+ diets and after ANG II infusion. PRC was measured using ANG I EIA from control and PRR KO mice on normal (0.26%)- and low (0.03%)-Na+ diets and 14 days following ANG II infusion (600 ng·kg−1·min−1; n = 8–10/group). *P < 0.001 vs. control. #P < 0.001 vs. normal-Na+ diet.
