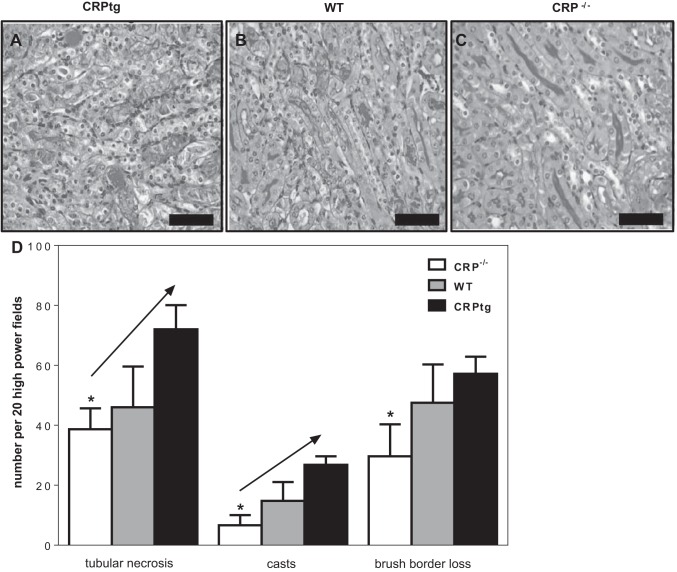
Fig. 3.
Organ histology after renal IRI. Representative periodic acid-Schiff (PAS)-stained thin sections of the outer medulla of kidneys collected 24 h after renal IRI from CRPtg (A), WT (B), and CRP−/− mice (C; ×40, scale bars = 25 μm). D: tubular necrosis, casts, and brush border loss were quantitated in kidney sections from CRP−/− (white bars), WT (gray bars), and CRPtg (black bars). Each bar represents the average ± SE of 20 microscopic fields examined for n = 3–6 mice of each genotype. Each measure of kidney damage was tested for a linear increase among genotypes (in left-to-right order) using ANOVA coupled with a linear trends test, and when P < 0.05 this is indicated by a diagonal arrow. The asterisks indicate P < 0.05 for unpaired t-tests (2-tailed) of CRP−/− vs. CRPtg.

