Fig. 8.
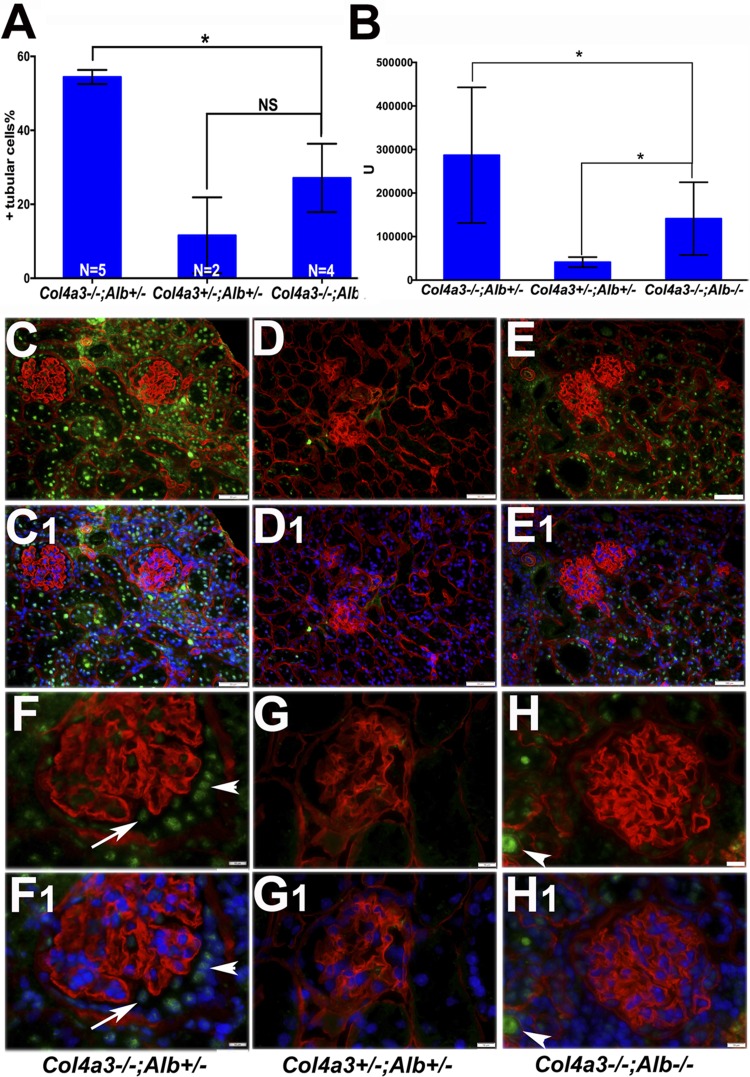
The absence of albumin attenuated transforming growth factor (TGF)-β1 signaling as assayed by nuclear phosphorylated (p-)SMAD2. Nuclear p-SMAD2 was detected by immunofluorescence in sections of 180- to 220-day-old Col4a3−/−;Alb+/−, Col4a3+/−;Alb+/−, and DKO kidneys. A and B: quantification of p-SMAD2 staining in tubular cells. A: percentage of p-SMAD2-positive tubular nuclei. Col4a3−/−;Alb+/− kidneys showed a significant increase in p-SMAD2-positive tubular cells compared with DKO kidneys. *P = 0.0085. The difference between DKO and control kidneys was not significant (NS, P = 0.22). B: mean fluorescence intensity of 100 positive nuclei. *P < 0.0001 for all groups. C–E: examples of p-SMAD2 nuclear localization in Col4a3−/−;Alb+/− kidneys (C) compared with control (D) and DKO (E) kidneys. Counterstaining with anti-nidogen (red) labeled all basement membranes. C1–E1: nuclei were counterstained with Hoechst 33342 to confirm p-SMAD2 nuclear localization. Original magnification was ×100. Scale bar = 100 μm. F–H: higher-magnification images showing nuclear p-SMAD2 distribution in glomeruli from 200-day-old mice. F1–H1: nuclei were counterstained with Hoechst 33342 to confirm p-SMAD2 nuclear localization. Arrowhead and arrow point to parietal epithelial cells with increased nuclear p-SMAD2 staining and a podocyte with nuclear p-SMAD2, respectively, in a Col4a3−/−;Alb+/− kidney. There was no detectable nuclear p-SMAD2 staining in control (G) or DKO (H) glomeruli. Arrowheads in H and H1 indicate background staining of a tubular cast. Original magnification was ×600. Scale bar = 10 μm.

