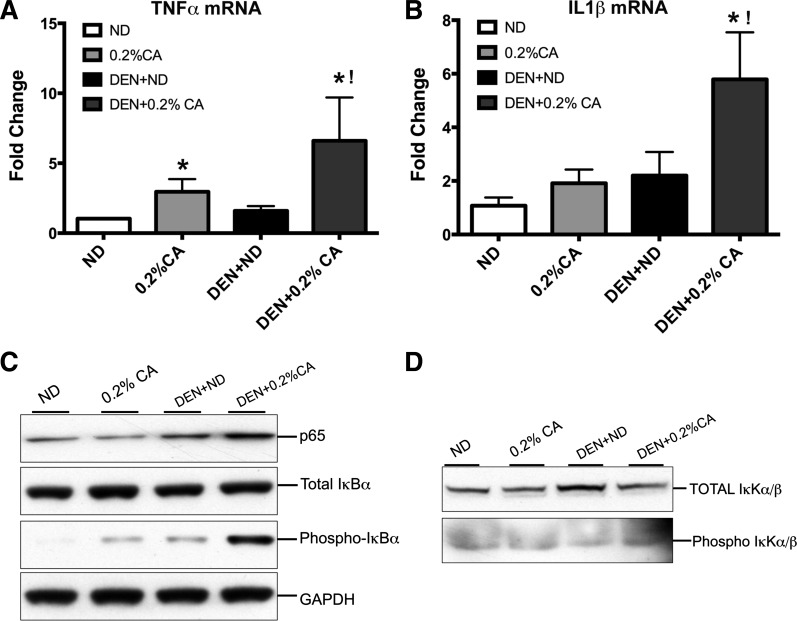
Fig. 4.
Increased inflammation in CA-promoted DEN-induced HCC. Real-time PCR analysis of TNF-α (A) and IL-1β mRNA (B) in various groups. Data are expressed as mean ± SE. *P < 0.05, significant difference from the ND group. !P < 0.05, significant difference from all other groups. Western blot analysis of total p65, total and phosphorylated IκBα (C) and total and phosphorylated IκKα/β (D) conducted using total liver extracts from various groups.

