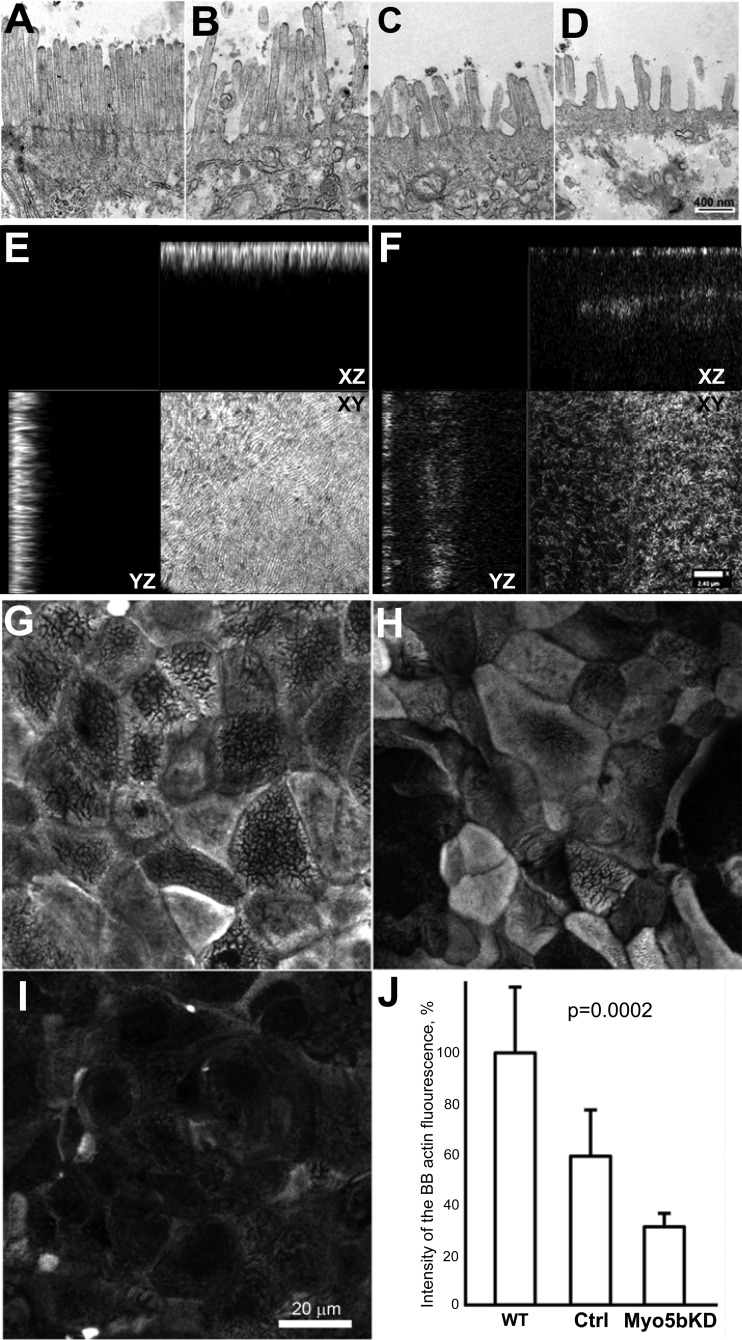
Fig. 3.
Brush border disorganization in Myo5bKD C2BBe cells. A–D: TEM demonstrates significant BB disorganization following Myo5bKD. Control C2BBe cells (A) and Myo5bKD C2BBe cells (B–D) with various degrees of BB disorganization. Scale bar, 400 nm. E–I: actin IFL in polarized C2BBe cells. gSTED Z-stack images demonstrate the dependence of fluorescence intensity on the degree of BB disorganization. XY planes are at the mid-BB level. E: control cells. F: Myo5bKD cells. G–I: representative confocal microscopy images of large areas of apical actin-stained scans used for quantification. Scale bar 20 μm. G: WT cells. H: scrambled control cells. I: Myo5bKD cells. J: quantification of apical actin immunofluorescence intensity.

