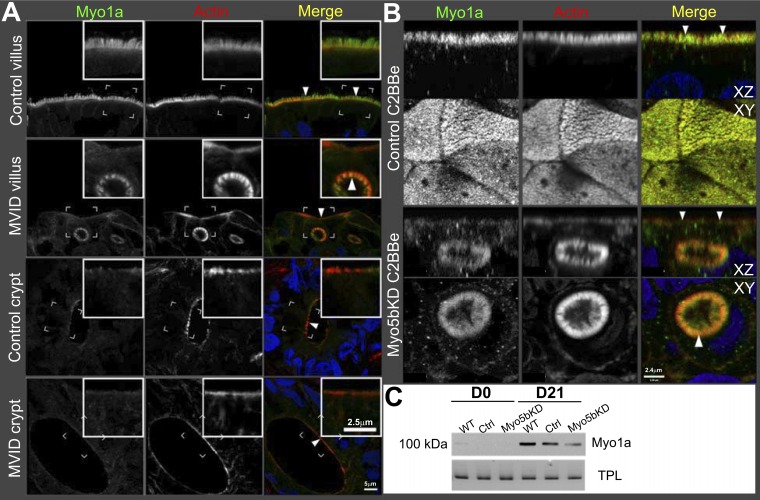
Fig. 7.
Myo1a localization in the human duodenum and C2BBe cells. Confocal microscopy images of Myo1a (green) IFL is shown in relation to F-actin (red); nuclei are stained in blue. A: control human and MVID duodenum cryosections. Insets, scale bar 2.5 μm; main panel, scale bar 5 μm. Brackets circumscribe the areas inserted under higher magnification. Arrowheads indicate Myo1a labeling in the microvilli of the normal brush border (control villus) and MVIs (MVID villus). No difference is visible in the Myo1a labeling pattern in crypts of control and MVID duodenum. B: confocal XY and XZ projections of Transwell-grown C2BBe monolayers. Arrowheads indicate Myo1a labeling in the microvilli of the normal brush border (scrambled C2BBe) and MVIs (Myo5bKD C2BBe). Scale bar, 2.4 μm. C: immunoblot analysis of Myo1a protein expression in immature (D0) mature (D21) control and Myo5bKD C2BBe cells. Total protein load (TPL) is shown.

