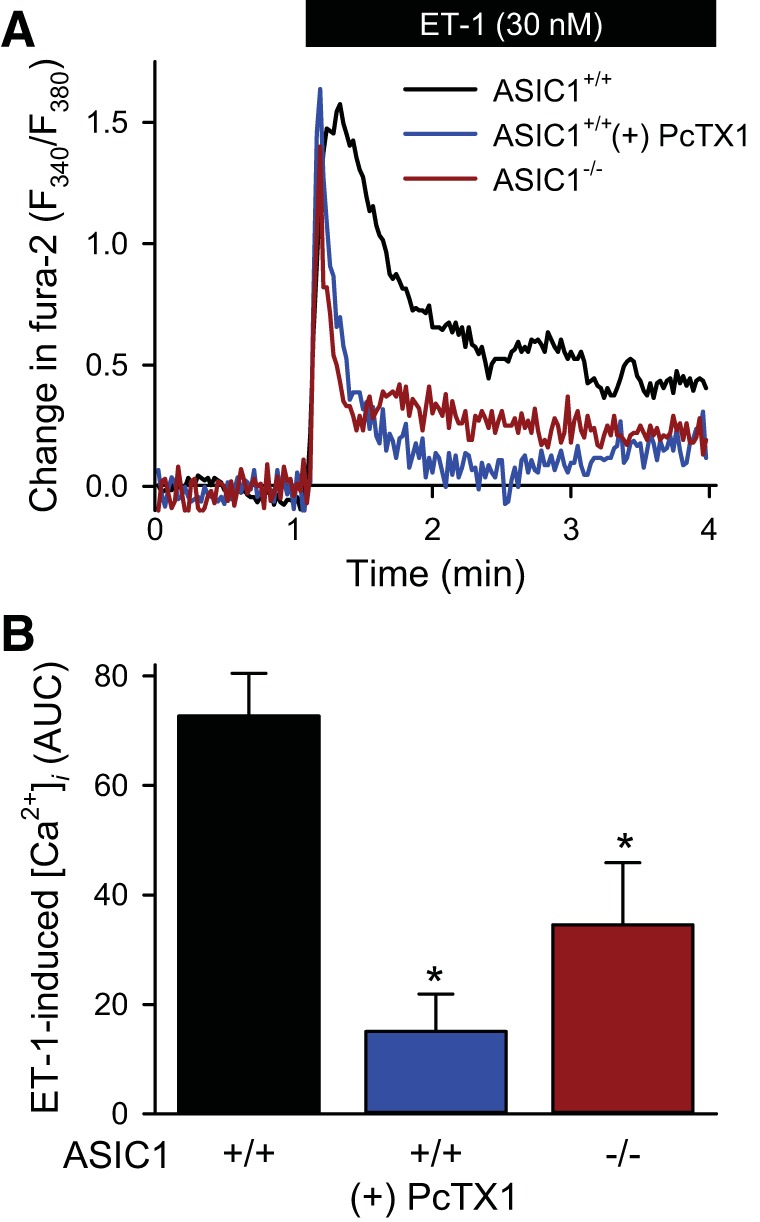
Fig. 4.

ASIC1 contributes to ET-1-induced Ca2+ influx in mouse PASMC. A: representative traces showing the change in fura-2 ratio. B: summary data of area under the curve (AUC) in response to ET-1 in mouse pulmonary arterial smooth muscle cell (PASMC) from ASIC1+/+ mice in the presence or absence of psalmotoxin 1 (PcTX1, 20 nM) or ASIC1−/− mice. Values are means ± SE, n = 4–6/group. *P < 0.05 vs. ASIC1+/+ mice analyzed by a one-way ANOVA and individual groups compared with the Student-Newman-Keuls test.
