Fig. 6.
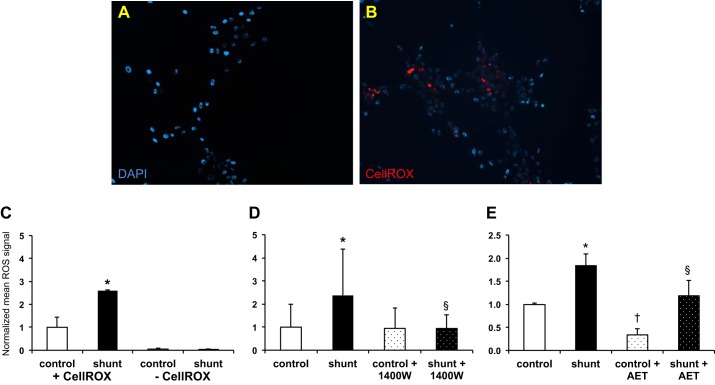
Measurement of reactive oxygen species (ROS) in LECs. Micrographs (×10) of control (A) and shunt (B) LECs. Nuclei are stained with DAPI (blue), and activated (CellROX) fluorophore (red), marks ROS. C: ROS accumulation is increased 2.6-fold in shunt LECs (+CellROX) compared with control LECs (+CellROX), *P < 0.05. ROS was quantified using a fluorescence microplate reader; for each assay, n = 3 control and 3 shunt and were tested in duplicate; data are presented as mean signal intensities ± SD normalized to control. Note that, in the absence of CellROX, the signal is negligible in both control and shunt LECs (−CellROX). D: pharmacological inhibition of iNOS with the selective inhibitor N-{[3-(aminomethyl)phenyl]methyl}ethanimidamide dihydrochloride (1400W) results in a 2.5-fold reduction in ROS levels in shunt LECs (§P < 0.05) and is equivalent to ROS levels measured in control LECs. Note that iNOS inhibition does not affect ROS levels in control LECs; n = 3 control and 3 shunt and were tested in quadruplicate in the absence or presence of 20 μM 1400W for 6 h before addition of CellROX. E: pharmacological inhibition using the nonselective NOS inhibitor 2-(2-aminoethyl)isothiourea dihydrobromide (AET) results in 1.6-fold decreased accumulation of ROS in shunt LECs (§P < 0.05) and 2.9-fold decreased ROS in control LECs (†P < 0.05). For this assay, n = 2 control and 2 shunt and were tested in duplicate in the absence or presence of 100 μM AET for 24 h before addition of CellROX. All data are presented as mean signal intensities ± SD normalized to control.

