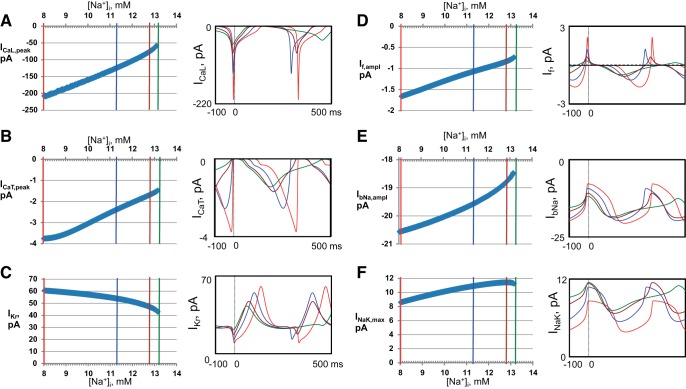
Fig. 12.
Insights gleaned using numerical model simulations on Na+ regulation of the cell membrane ion currents (via direct and indirect effects). Plots of continuous membrane current changes (left) for over the entire range of [Na+]i from 8 to 14 mmol/l illustrated with their representative waveforms (right) at the 4 key [Na+]i. Colors representing different [Na+]i match colors in Fig. 9. The overlapped traces are synchronized at the AP overshoot (vertical dashed lines). A: L-type Ca2+ current (ICaL). B: T-type Ca2+ current (ICaT). C: rapid delayed rectifier K+ current (IKr). D: funny current (If). E: Na+ background current (IbNa). F: Na+/K+ ATPase current (INaK, remaining after INaK inhibition by DG).

