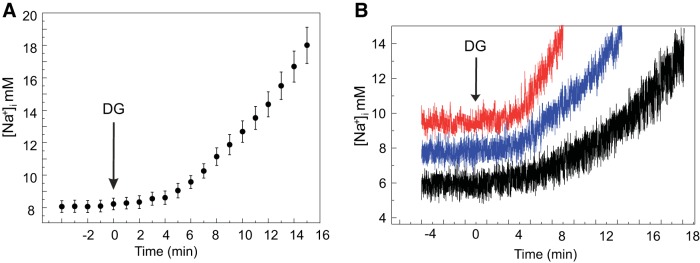
Fig. 2.
[Na+]i increases in response to DG in spontaneously beating sinoatrial nodal cells (SANCs). A: average [Na+]i change at baseline and every minute following 10 μmol/l DG exposure in spontaneously beating SANCs (n = 7). The arrow indicates the time when superfusion with DG started (2-sample paired t-test for means was used to compare [Na+]i before and after DG exposure; see details in Table 2). B: example of [Na+]i change in 3 different SANCs.

