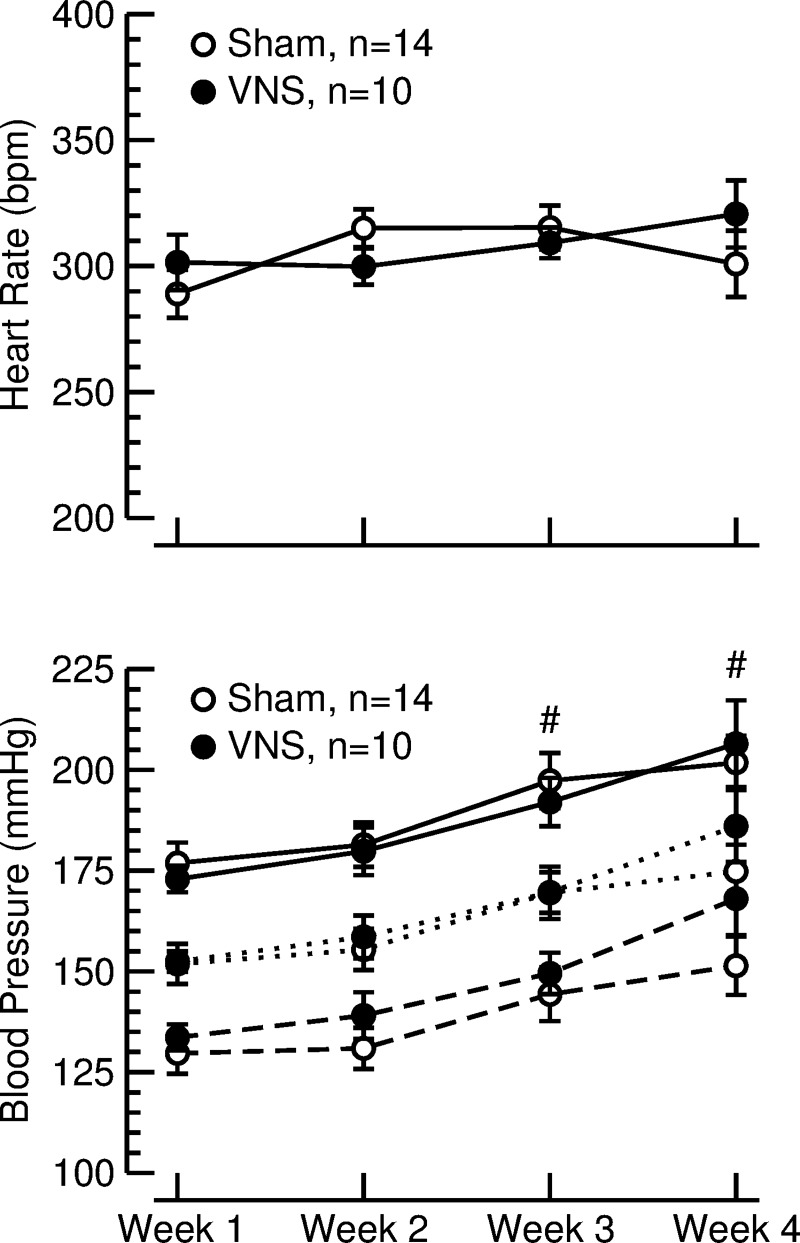
Fig. 3.
Heart rate (top) and systolic (solid lines), mean (dotted lines), and diastolic (dashed line) blood pressure (bottom), during 4 wk of sham stimulation (sham; ○) or vagal nerve stimulation (VNS; ●). Values are averages of weekly 24-h recordings (means ± SE). #P < 0.05 vs. week 1 for systolic, mean, and diastolic blood pressure in both groups.

