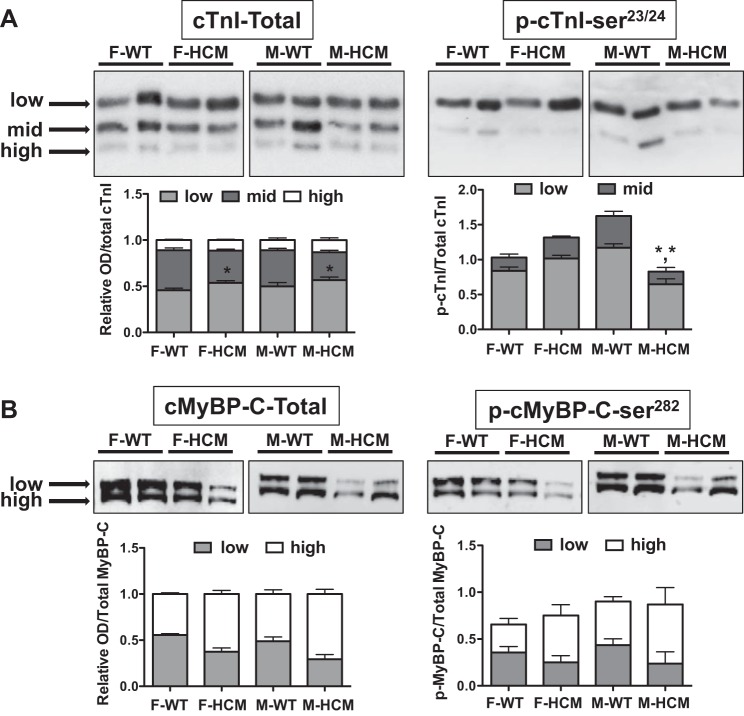
Fig. 8.
Phosphate-affinity SDS-PAGE (SDS-PAGE-PhosTag) for total cTnI or cMyBP-C and p-cTnI at p-cTnI-Ser23/24 or cMyBP-C at p-cMyBP-C-Ser282. SDS-PAGE-PhosTag of left ventricular myocardial samples from male, female, WT, or HCM mice (n = 4–6/group) followed by Western blot analysis with cTnI antibodies targeting p-cTnI-Ser23/24 or p-cMyBP-C-Ser282 only when phosphorylated. A, top: representative SDS-PAGE-PhosTag followed by Western blot with a total cTnI (left) or p-cTnI-Ser23/24 (right) antibody illustrating distinct bands corresponding to low, mid, and high gel mobility. Stacked bar graph summary indicating the relative amounts of phosphospecies for each experimental group. B, top: representative SDS-PAGE-PhosTag followed by Western blot with a total cMyBP-C or p-cMyBP-C-Ser282 antibody illustrating 2 distinct bands corresponding to low and high gel mobility. Stacked bar graph summary indicating the relative amounts of phosphospecies. Each lane was normalized to total cTnI or cMyBP-C. A 2-way ANOVA followed by a Bonferroni post hoc test determined differences between HCM and WT groups. *P < 0.05 from cTnI WT counterpart; *,*P < 0.05 when comparing low- and high-mobility bands between HCM and WT males.

