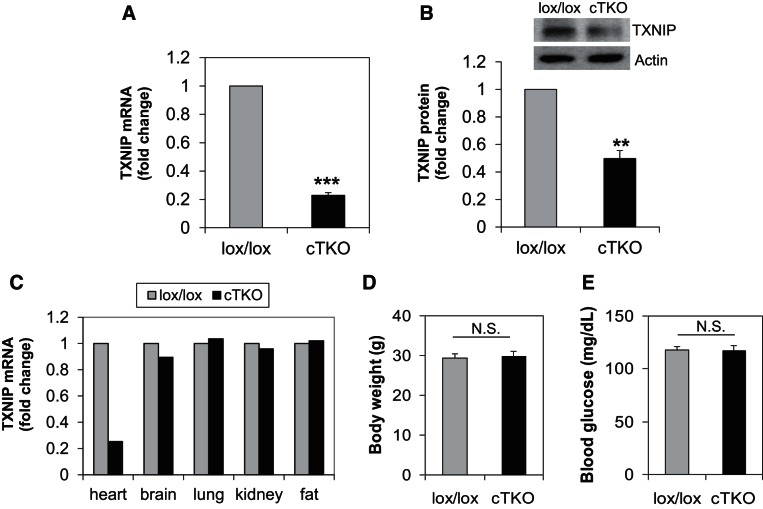
Fig. 1.
Characterization of cardiomyocyte-specific TXNIP knockout (cTKO) mice. TXNIP mRNA level (A) and TXNIP protein level (B) in primary ventricular samples of cTKO and lox/lox control mice, comparison of TXNIP expression levels in different tissues of cTKO and control mice (C), body weight (D), and blood glucose (E) in cTKO and control mice. Twenty-week-old male mice (n = 3 per group) were used; values are expressed as means ± SE. **P < 0.005; ***P < 0.001; N.S., not significant (Student's t-test).

