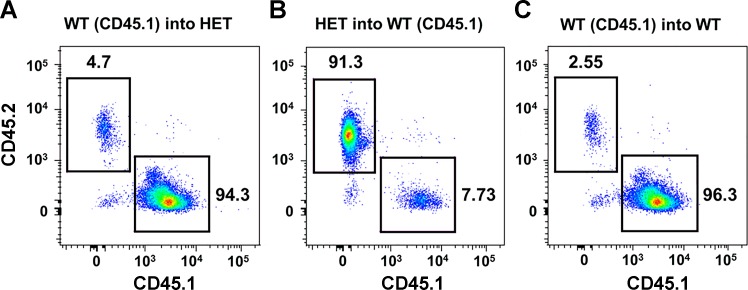
Fig. 9.
Fluorescence-activated cell sorting. A: reconstitution of irradiated SOCS3+/− mice with WT (CD45.1) bone marrow. X-axis represents WT (CD45.1) bone marrow. Y-axis represents SOCS3+/− bone marrow. B: reconstitution of irradiated WT (CD45.1) mice with SOCS3+/− bone marrow. X-axis represents WT (CD45.1) bone marrow. Y-axis represents SOCS3+/− bone marrow. C: reconstitution of irradiated SOCS3+/+ mice with WT (CD45.1) bone marrow. X-axis represents WT (CD45.1) bone marrow. Y-axis represents SOCS3+/+ bone marrow.

