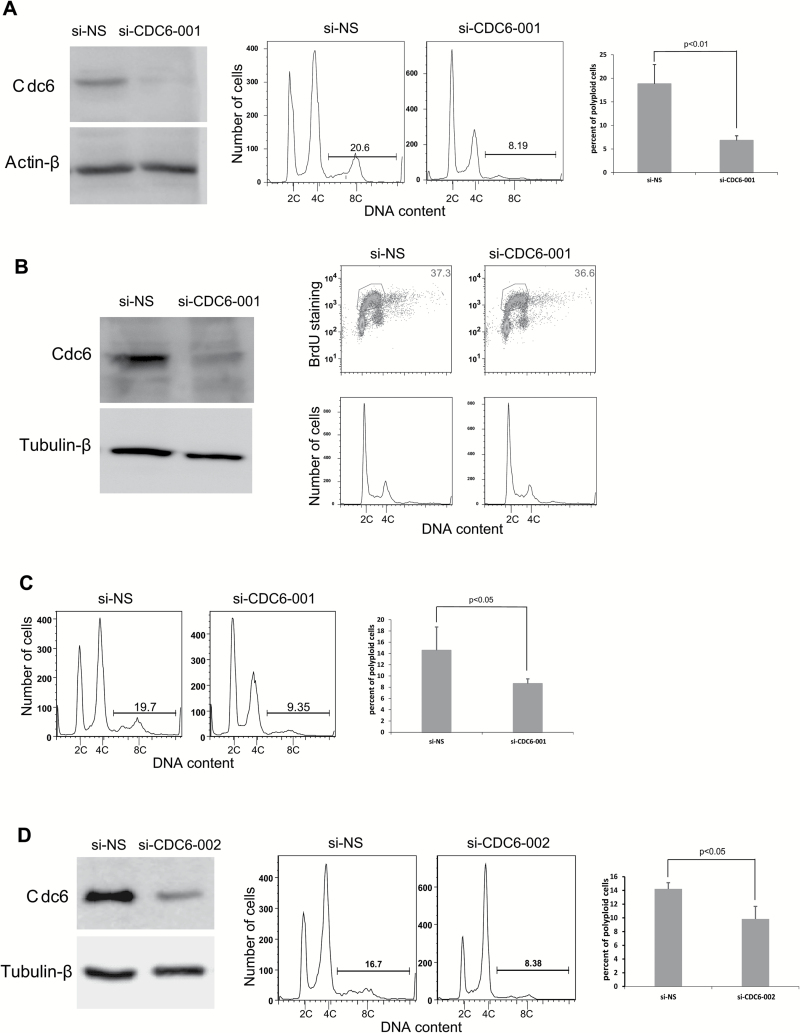
Figure 2.
The downregulation of Cdc6 impairs the ability of E7 to induce polyploidy. RPE1 E7 cells were transfected with Cdc6 siRNAs, and DNA content/BrdU staining was analyzed by FACS. (A) Cdc6 protein levels were measured by immunoblotting 72h after si-CDC6-001 (20nM) transfection (left panel). For cell cycle analysis, bleomycin was added 24h post-transfection and incubated for an additional 48h. The cell cycle profiles are shown in the middle panel. The data are quantified and summarized in the right panel. (B) Regularly cultured RPE1 E7 cells were transfected with 500 pM si-CDC6-001 siRNA. Left panel, Cdc6 protein levels were measured by immunoblotting. A representative image from two independent experiments is shown. The cell cycle profiles are shown in the right panel; BrdU-positive cells are indicated. A histogram of the same profiles is shown below. (C) After si-CDC6-001 (500 pM) transfection, RPE1 E7 cells were treated with bleomycin. A representative image from two independent experiments of four determinants is shown (left panel). The data are summarized in the right panel. (D) After si-CDC6-002 transfection, the cells were treated with bleomycin and analyzed for Cdc6 expression (left panel) and cell cycle profiles (middle panel). A representative image from at least three independent experiments is shown, and the data are summarized (right panel). Error bars reflect the standard deviations of the mean. NS-siRNA, non-silencing siRNA.

