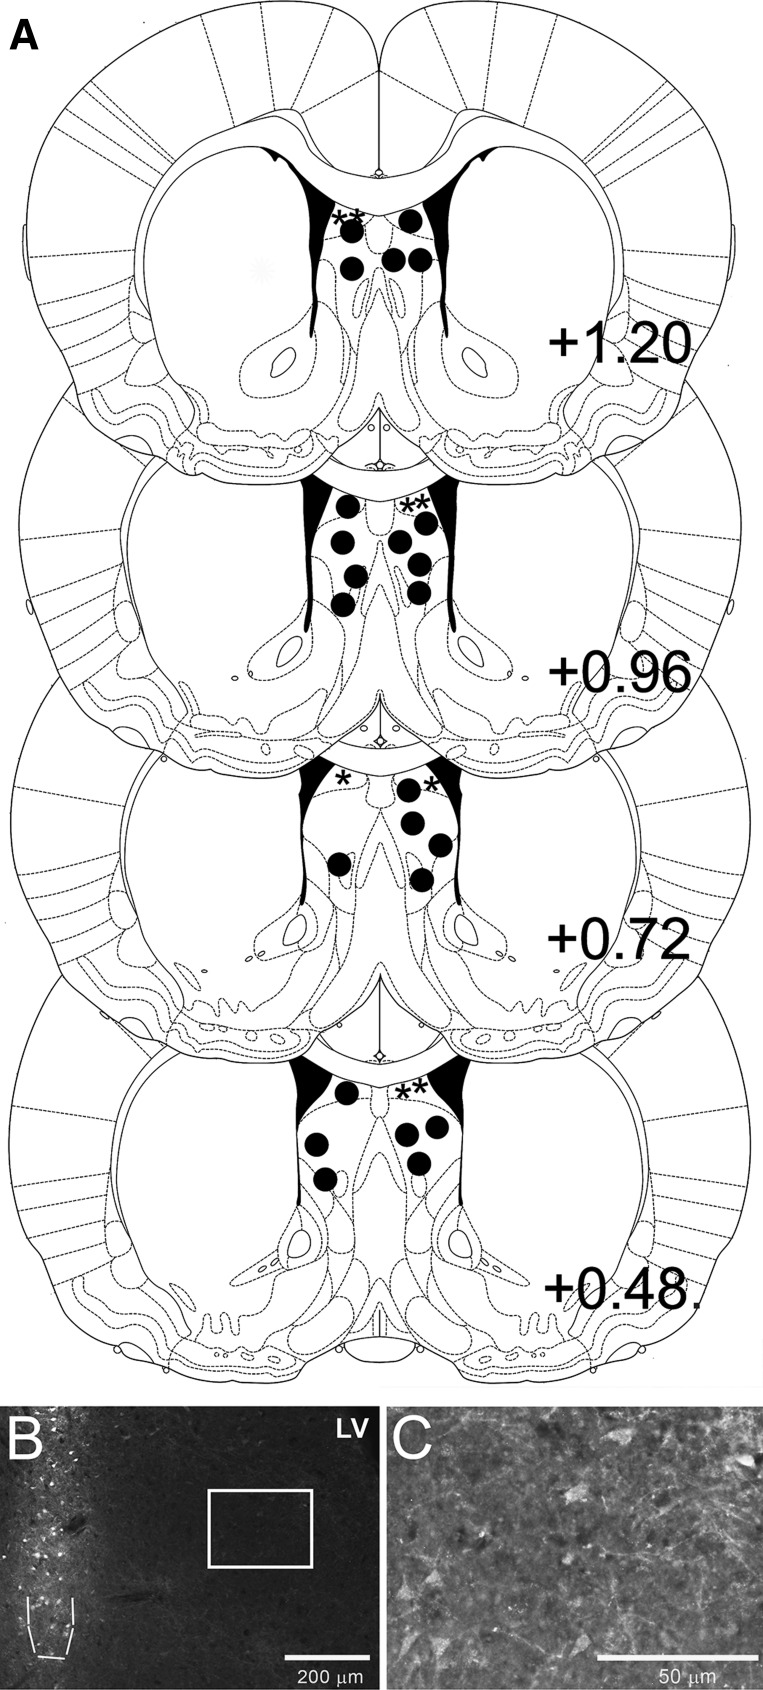
Fig. 2.
A: diagram of representative LS injection placements based on the atlas of Paxinos and Watson (26). Additional subjects' injection sites were identified in similar locations at points between the anterior-posterior levels displayed here. Solid circles (●) represent LS placements from studies 2–7, while asterisks (*) represent dorsal lateral septum (dLS) placements from study 8. B: representative image of intra-LS HiLyte Fluor 647-labeled Ex4 injection. The site of injection is outlined with a dashed line. Faint fluoro-Ex4 labeling to ∼0.6 mm around the site of injection can be observed. C: higher-magnification image taken from the area inside the white box in B shows the lower-density fluoro-Ex4 labeling.

