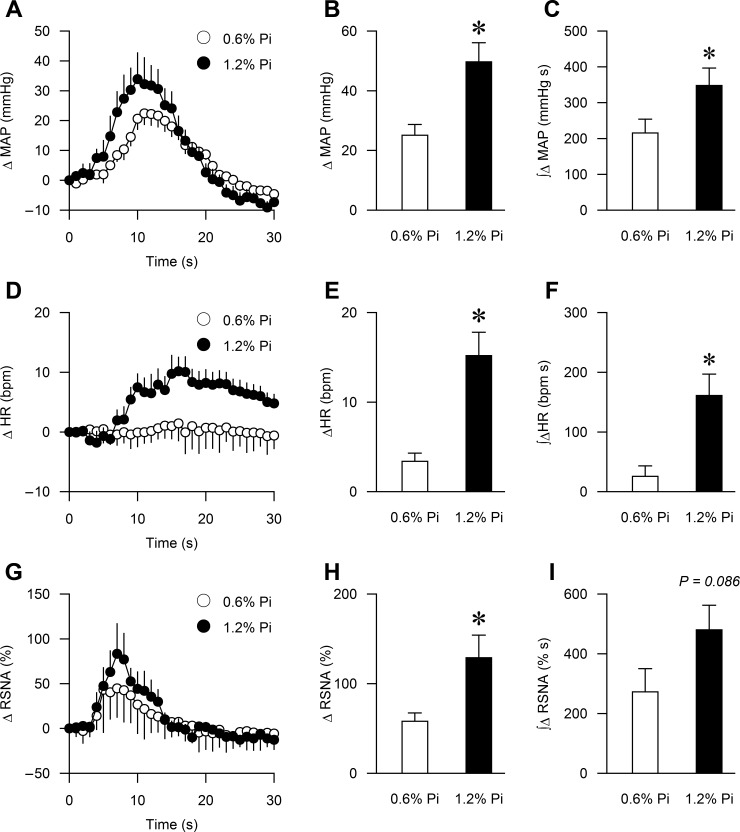
Fig. 6.
Summary data showing cardiovascular and sympathetic responses to activation of the metabolically sensitive component of the EPR in the 0.6% Pi (n = 13) and 1.2% Pi (n = 13) rats. The time course of changes in MAP, HR, and RSNA are shown in A, D, and G. The peak MAP, HR, RSNA, and tension responses to intrafemoral capsaicin are shown in B, E, and H. The integrated changes in MAP, HR, and RSNA, which are presented as AUC over 30 s, are shown in C, F, and I. *P < 0.05 compared with 0.6% Pi.

