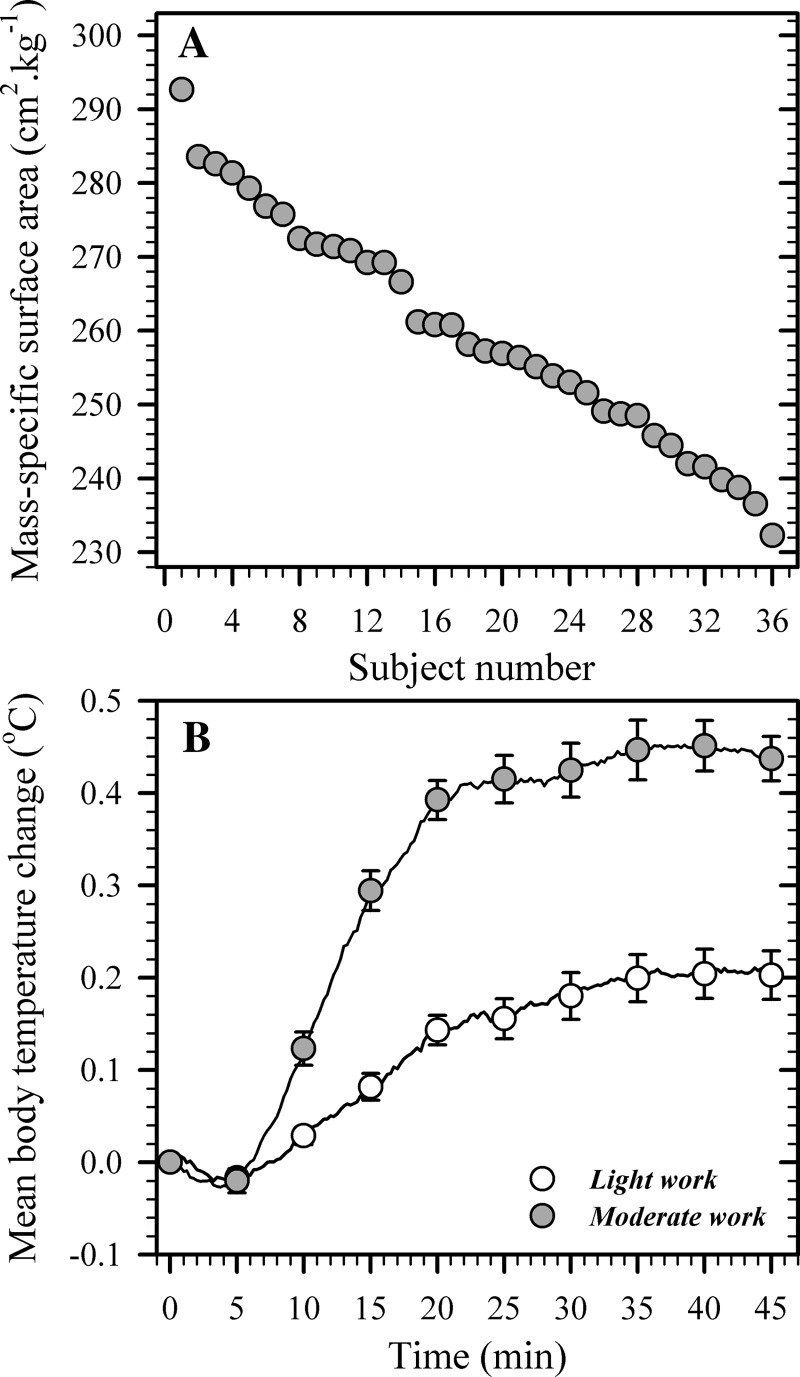
Fig. 1.
A: variations in mass-specific surface area (cm2/kg) of participants within this experiment (n = 36), arranged in descending order. B: mean body temperature changes during exercise (45 min) performed at fixed, area-specific metabolic heat-production rates of either ∼135 W/m2 (n = 36, light work) or ∼200 W/m2 (n = 35, moderate work) following a resting, thermal equilibration period in a warm-dry environment (28°C, 37% relative humidity). Data are presented as average response curves with means ± SE provided at 5-min intervals.

