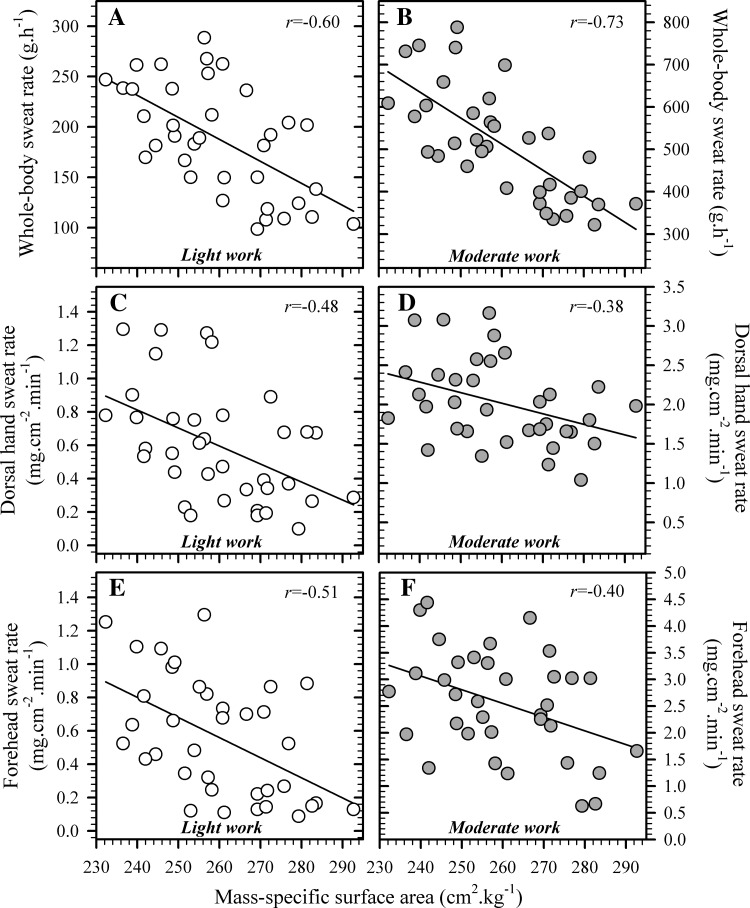
Fig. 3.
Relationships between mass-specific surface area and whole-body sweat rate (A and B), local sweat rate at the dorsal hand (C and D) and forehead (E and F) during light (∼135 W/m2, n = 36) and moderate work (∼200 W/m2, n = 35). Data were collected during steady-state exercise (45 min) that proceeded 20 min of resting, thermal equilibration (28°C, 37% relative humidity), and are means for each individual over the final 5 min of exercise. Solid lines are least-squares, best-fit, linear regressions, with all correlations being significant (P < 0.05).

