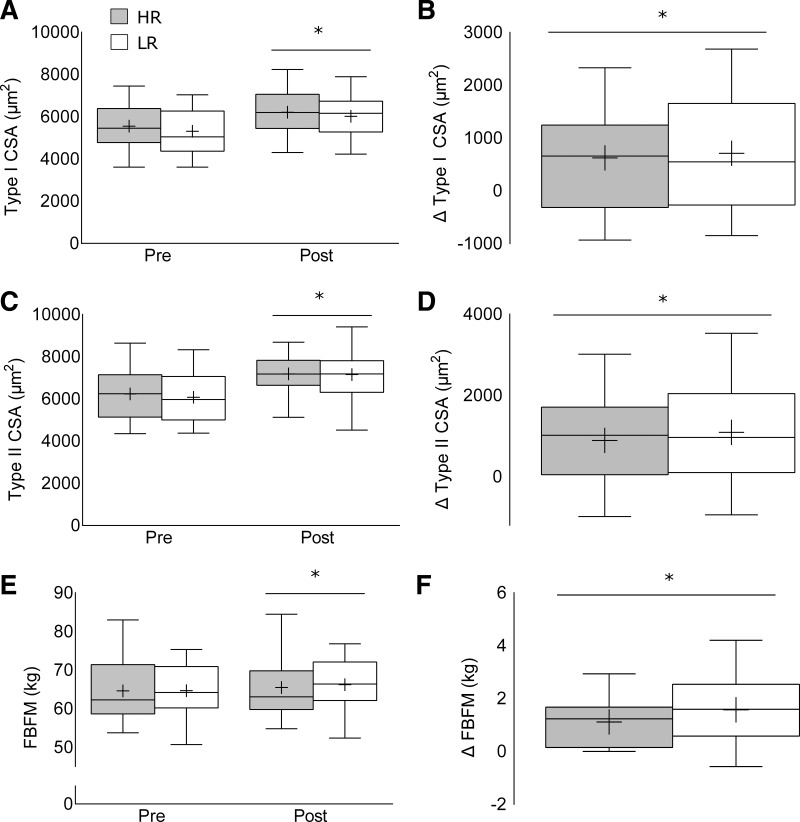
Fig. 3.
Fiber cross-sectional area (CSA) and body composition changes in the high-repetition (HR) and low-repetition (LR) groups following 12 wk of resistance training including type I CSA absolute values (A) and change following training (B), type II fiber CSA absolute values (C) and change following training (D), and fat- and bone-free (lean) body mass (FBFM) absolute values (E) and change following training (F). Values are presented as median (lines) with interquartile range (boxes) ± range (minimum and maximum), where + indicates mean. *Significantly different (P < 0.05) from baseline.

