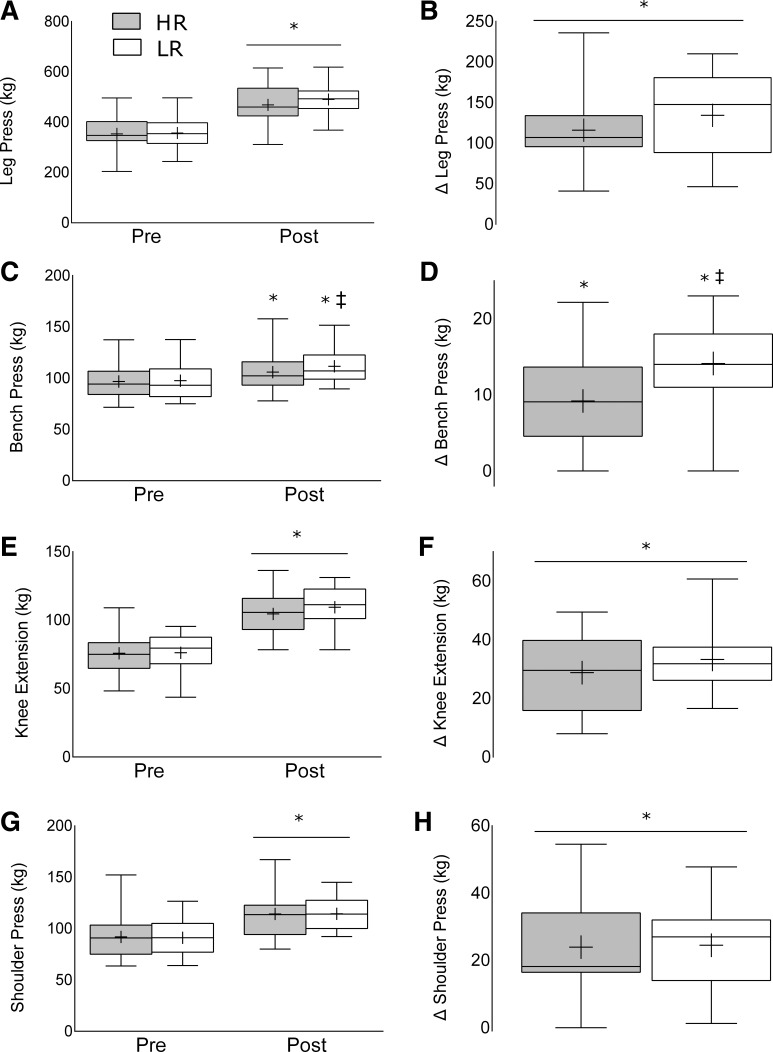
Fig. 4.
Strength changes in the high-repetition (HR) and low-repetition (LR) groups following 12 wk of resistance training for the leg press absolute values (A) and change following training (B), bench press absolute values (C) and change following training (D), knee extension absolute values (E) and change following training (F), and shoulder press absolute values (G) and change following training (H). Values are presented as median (lines) with interquartile range (boxes) ± range (minimum and maximum), where + indicates mean. *Significantly different (P < 0.05) from baseline. ‡Significantly different (P < 0.05) between HR and LR.

