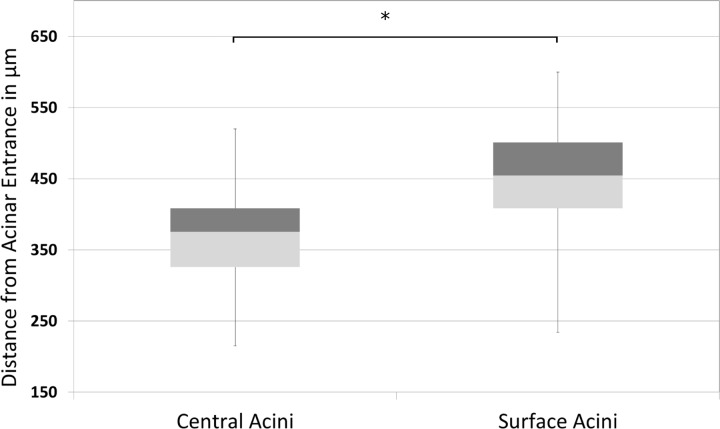
Fig. 9.
Box and whisker plot showing the minimum, first quartile, median, third quartile, and the maximum path lengths from acinar entrance to a terminal node in surface acini compared with central acini. On average, surface acini have increased path lengths, greater number of terminal nodes, and a wider range in total path length. The mean longitudinal path length is significantly increased in surface acini (*P < 0.01).

