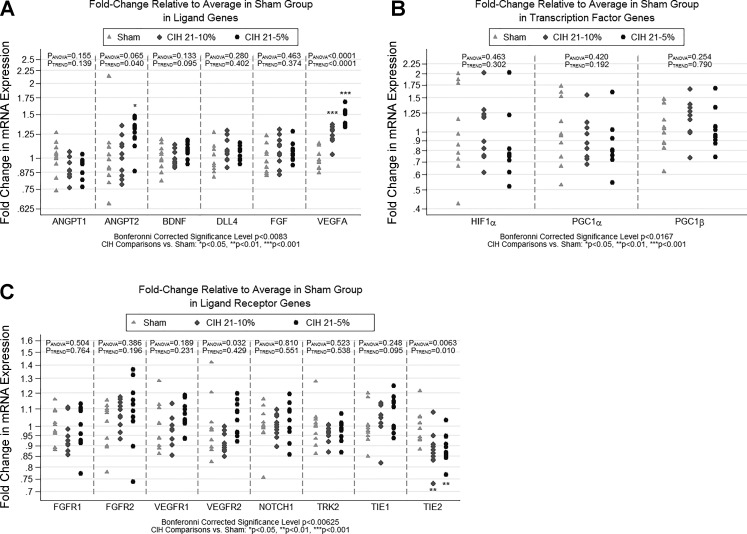
Fig. 3.
Fold change in qPCR gene expression for angiogenesis-related genes. The figure illustrates the results of qPCR analyses examining expression of three subsets of genes hypothesized to be related to angiogenesis. Results are shown as fold change in expression relative to the sham condition. Fold change is measured as 2−ΔΔCT for each gene, where the first Δ is the average CT of the housekeeping genes, and the second Δ is the average ΔCT in the sham condition. Analyses were based on −ΔΔCT values, which are measured on a linear scale. Based on a priori hypothesized pathways, genes were separated into 3 distinct domains/subgroups. A: ligands: VEGFA, ANGPT1, ANGPT2, BDNF, FGF, and DLL4. B: ligand receptors: VEGFR1, VEGFR2, TIE-1, TIE-2, TRK2, FGFR-1, FGFR-2, NOTCH1. C: transcription factors: HIF-1α, PGC-1α, and PGC-1β. Statistical significance was based on a domain-specific Bonferroni corrected α-level (equal to 0.05 divided by the number of genes in the domain). Significant or nominally significant differences were observed for VEGFA, ANGPT2, VEGFR2, and TIE-2. The strongest differences among conditions were seen for VEGFA (P < 0.0001; significant after correction for multiple ligand genes), with both CIH5 and CIH10 showing significantly increased expression compared with sham. We also observed nominal or borderline significant differences among the conditions for the ligand gene ANGPT2 and ligand receptors VEGFR2 and TIE-2. We note that the TIE-2 result was just slightly above our Bonferroni-corrected threshold for significance (P < 0.00625). Significant difference vs. sham: *P < 0.05, **P < 0.01, ***P < 0.001.

