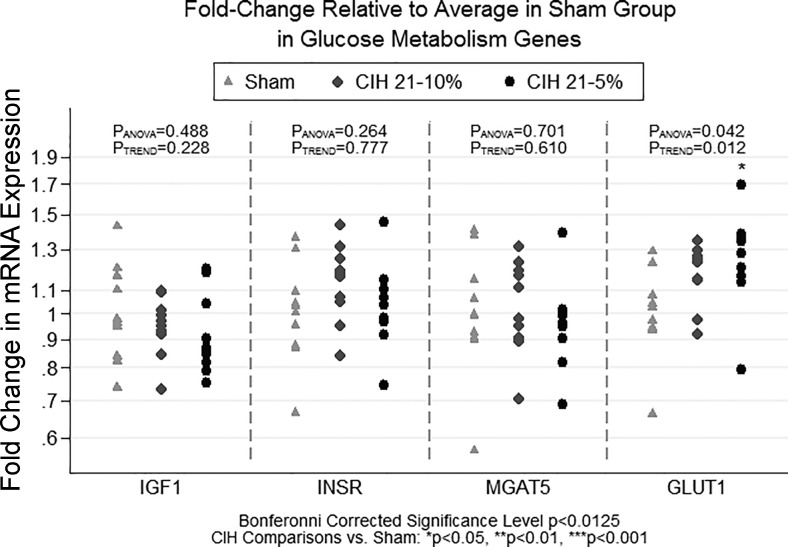
Fig. 4.
Fold change in qPCR gene expression for glucose metabolism genes. The figure illustrates the results of qPCR analyses examining expression of IGF-I, INSR, MGAT5, and GLUT1, genes hypothesized to be related to metabolism within the hippocampus across CIH severities. Results are shown as fold change in expression relative to the sham condition. Fold change is measured as 2−ΔΔCT for each gene, where the first Δ is the average of the housekeeping genes, and the second Δ is the average ΔCT in the sham condition. Analyses were based on −ΔΔCT values, which are measured on a linear scale. We observed a significant difference in GLUT1 expression among CIH severity groups, with the CIH5 group showing significantly higher expression compared with sham. There is also evidence of a linear dose response in mRNA expression across CIH conditions. Significant difference vs. sham: *P < 0.05.

