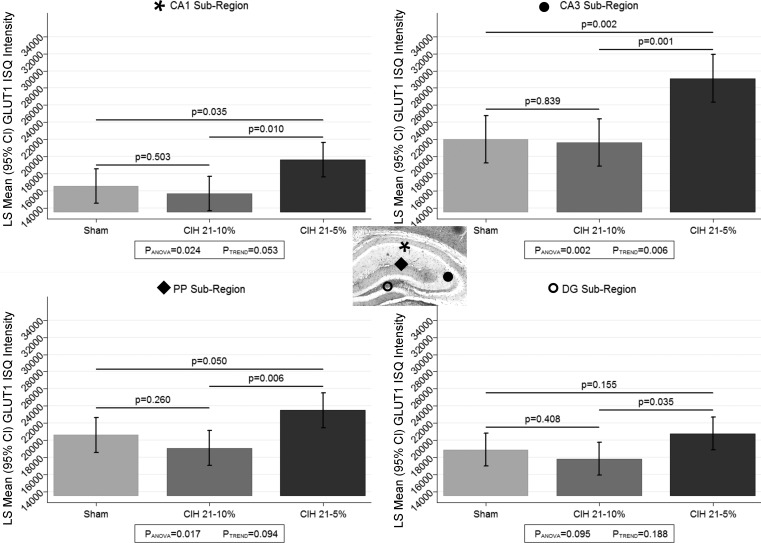
Fig. 7.
ISQ for GLUT1 within brain subregions. We used the ISQ technique to assess the intensity of the GLUT1 protein on the microvessels in our 3 CIH conditions and present results stratified by brain subregion [CA1 (denoted by *), CA3 (denoted by ●), PP (denoted by ⧫), and DG (denoted by ○); see inset]. We observed significant differences among the conditions in all but the DG subregion. In general, as with the overall analysis, CIH5 showed significantly higher GLUT1 intensity compared with either the CIH10 or sham conditions. There were significant differences in the overall GLUT1 intensity across subregions, with the CA3 showing the most GLUT1 and CA1 the least. IQ, ??.

