
Fig. 2.
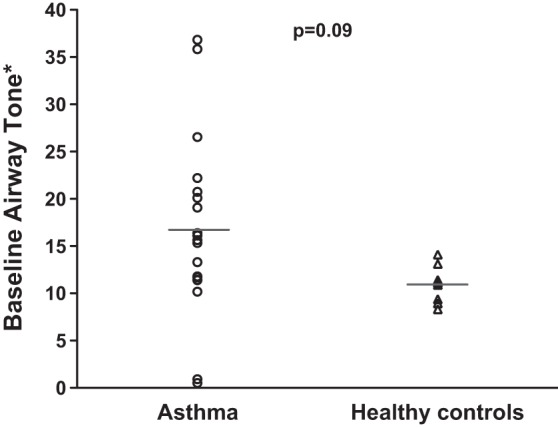
Baseline airway tone in the asthma and the healthy groups. ○, mean airway tone for all airways in each study participant in the asthma group; △, mean airway tone for all airways in each healthy participant. The horizontal lines represent the mean airway tone for all the subjects in each group. No significant difference between the two groups was found (P = 0.09). *Baseline airway tone is defined as 100 − [(Airway diameter at TLC baseline)/(Airway diameter at TLC relaxed)] × 100.