
Fig. 1.
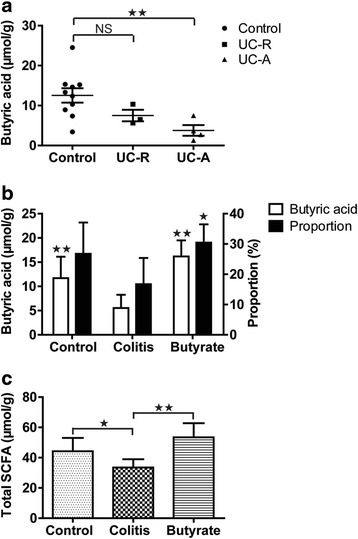
Intestinal fatty acid levels. Human fecal butyrate concentration (a). Rat fecal butyric acid concentration and percentage of total SCFA content (b). Rat fecal total SCFA content (c). Data are the mean ± SE. n = 5–7. *P < 0.05; **P < 0.01; NS: No Significance. UC-R, remission phase of ulcerative colitis; active phase of ulcerative colitis