
Fig. 3.
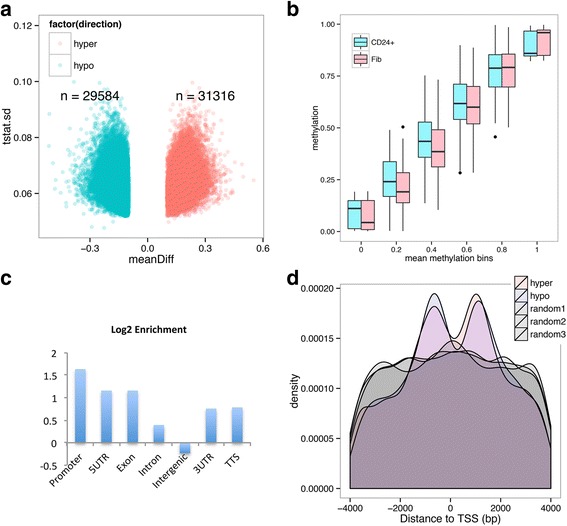
WGBS revealed CpG methylation alterations in iPMSCs compared with fibroblast cells. a Volcano plot depicting the DMRs in iPMSCs compared with fibroblasts (Fib), with the horizontal axis representing methylation differences and the vertical axis representing the standard deviation (sd) in t statistics. b Box plot showing the distribution of CpG sites based on different methylation levels. c Bar plot showing the enrichment of DMRs in different genomic features. d Distribution of DMR distances to its closest TSS; controls are generated by randomly sampling 60,000 regions of 200 bp from hg19