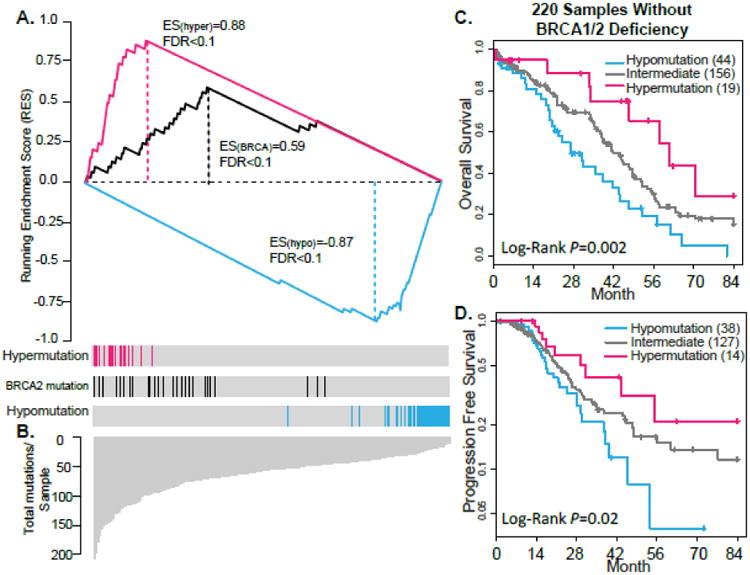
Figure 1. The BRCAness and its association with survival.

(A) Enrichment Score (ES) test of genome instability in BRCAness, Hypomutated and BRCA2-mutated cases (positive control). The bottom portion of the plot shows the total numbers of non-synonymous mutations of 316 decreasingly ranked OvCa cases. The height of each line indicates the number of non-synonymous mutations in each OvCa case. The middle portion of the plot shows where the samples with BRCAness (red bar) or BRCA2 mutations (black bar) and hypomutation (blue bar) appear in the ranked list of samples in the bottom portion. The top portion of the plot shows the running ES for the BRCA1- or BRCA2-mutated cases. (B & C) Kaplan-Meier survival curves for OS (B) and PFS (C) durations of BRCAness, Intermediate, and Hypomutated patients in 220 BRCAwt cases. The percent probability of survival is plotted versus time since diagnosis in months.
