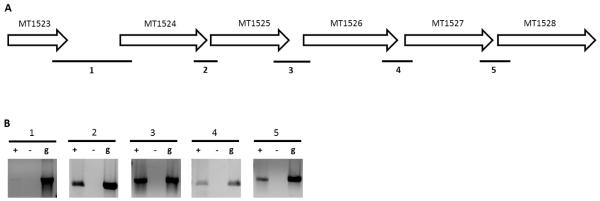
Figure 3. Validation of the MT1523-MT1528 operon.
(A) Genetic locus of the MT1523-MT1528 predicted operon. Numbered bold lines indicate IGRs that are PCR amplified. The lengths of IGRs are IGR1:806nt, IGR2: 11nt, IGR3: 139nt. IGR4:49nt and IGR5: 11nt. (B) PCR amplified cDNA from IGRs run on a 1.0% agarose gel (Lane “+”). cDNA samples without reverse transcriptase (Lane ”−“) and gDNA (Lane “g”) were used as negative and positive controls respectively.

