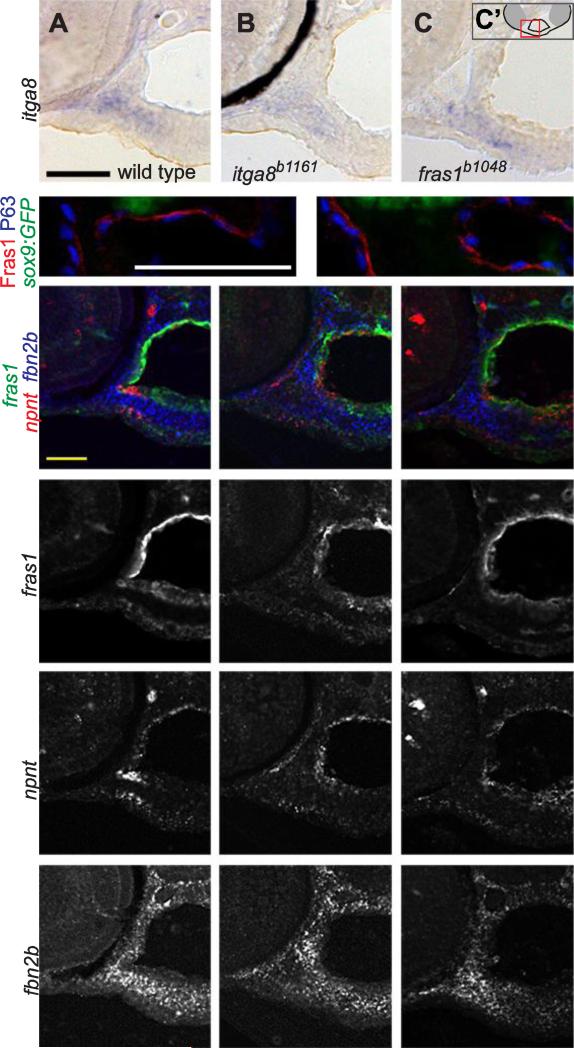
Figure 5.
fras1 and itga8 do not regulate one another, nor do they regulate candidate targets npnt or fbn2b. (A-C) RNA in situ hybridization for itga8 transcripts on transverse sections in 60 hpf wild-type and mutant embryos, developed colorimetrically, oriented as shown in C'. These transcripts appear similar in (A) wild type, (B) itga8 mutants, and (C) fras1 mutants. The black crescent in (B) is eye pigment. (D, E) 72 hpf tissue sections, labeled for Fras1 protein, epithelial nuclei (anti-P63) and cartilage (sox9a:GFP). Fras1 protein levels and localization appears similar in wild type (D) and itga8b1161 mutants (E). (F-Q) Triple in situ hybridization for fras1, npnt, and fbn2b transcripts on 60 hpf tissue sections, oriented as in Fig. 4E. (F-H) Merged overlays of all three probes, which are also shown separately for fras1 (I-K), npnt (L-N) , and fbn2b (O-Q). For all three genes, expression is similar between wild type, fras1 mutants, and itga8 mutants. All scale bars: 50 μm. Scale bar in A applies to A-C. Scale bar, in D applies D, E. Scale bar in F applies to F-Q.

