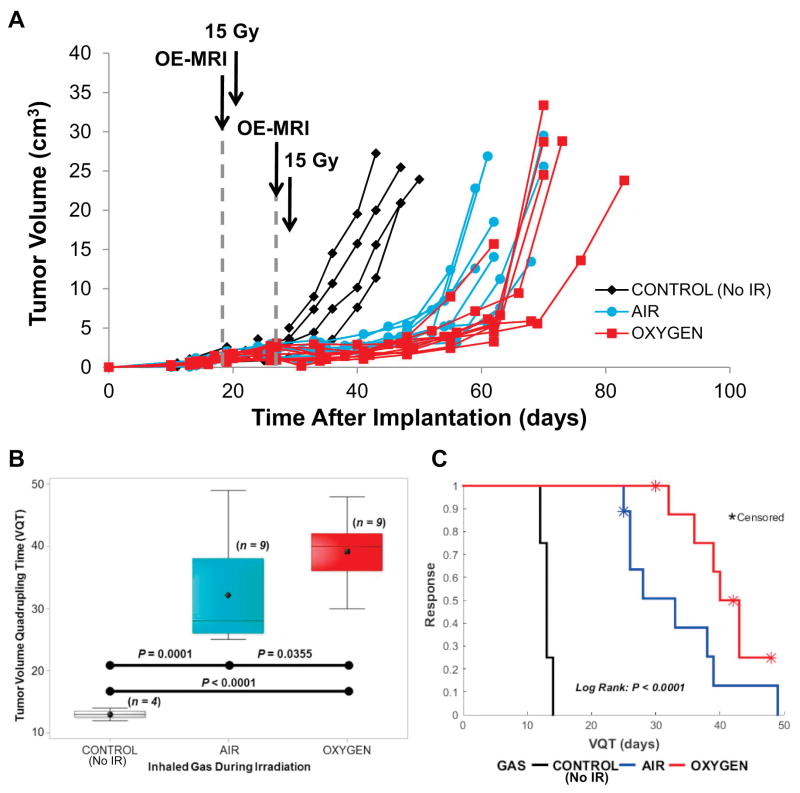
Figure 2. Tumor response to radiation.
A) Growth curves for individual Dunning prostate R3327-AT1 tumors: non-irradiated control tumors (Group 1; n = 4, black diamonds), irradiated while breathing Air (Group 2; n = 9, blue circles), or irradiated while breathing Oxygen (Group 3; n = 9, red squares). Irradiated tumors showed an obvious growth delay in response to a split-dose schedule of 2F × 7.5 Gy AP/PA 7 days apart.
B) Irradiation caused a significant tumor growth delay as shown for time to quadruple in volume (VQT). Tumors on rats breathing oxygen showed a significantly greater delay. Box and whiskers plots show mean, median, inter quartile and full ranges.
C) The tumor growth delay is apparent in the Kaplan-Meier survival plot. The log rank test (adjusted for five (1 air and 4 oxygen) censored indicated significant differences among the irradiation breathing treatment event time distributions.

