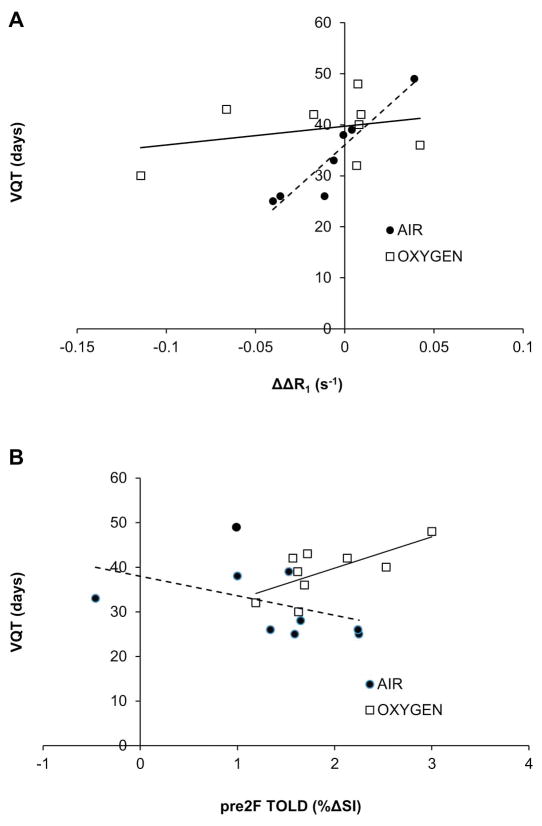
Figure 3. Correlations between OE-MRI and tumor growth delay.
Data separated with respect to inhaled gas during tumor radiation: Air (filled circles) or Oxygen, (open squares) versus time to reach four times the initial irradiated tumor volume (VQT). A) Strong correlation was observed for the difference in responses between the 2nd and 1st ΔR1 (ΔΔR1) and VQT (R >0.93, P <0.002) for those animals inhaling Air, but much weaker for the Oxygen Group. B) A moderate correlation was observed between TOLD before the 2nd irradiation and VQT (R >0.6, P =0.0051) for animals breathing Oxygen, but not Air.

