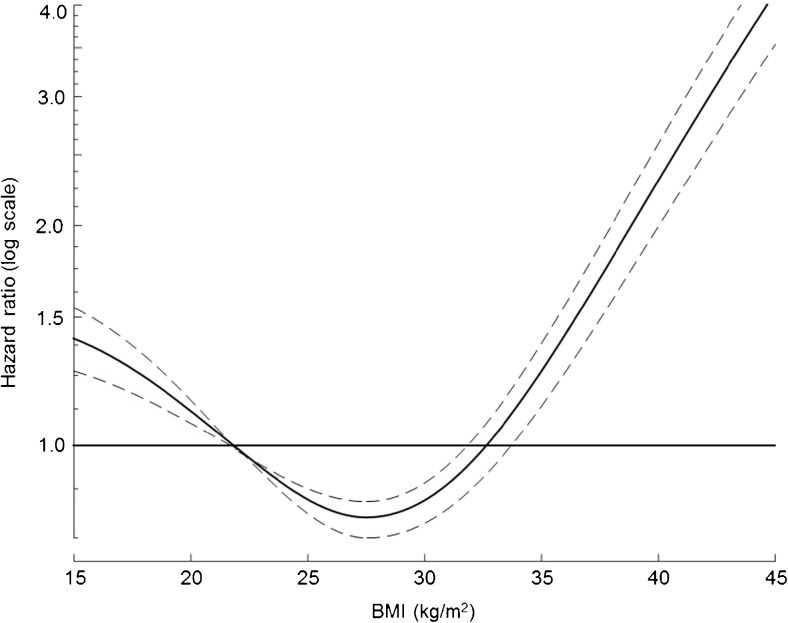
Fig. 1.
An illustration of the obesity paradox. The vertical axis represents hazard ratio of mortality (log scale), compared with the baseline BMI of 22.5 kg/m2. The plot represents a population in which the obesity paradox is observed, since the hazard ratio is below 1 in the overweight and obese range. The 95 % confidence intervals are shown with dashed lines

