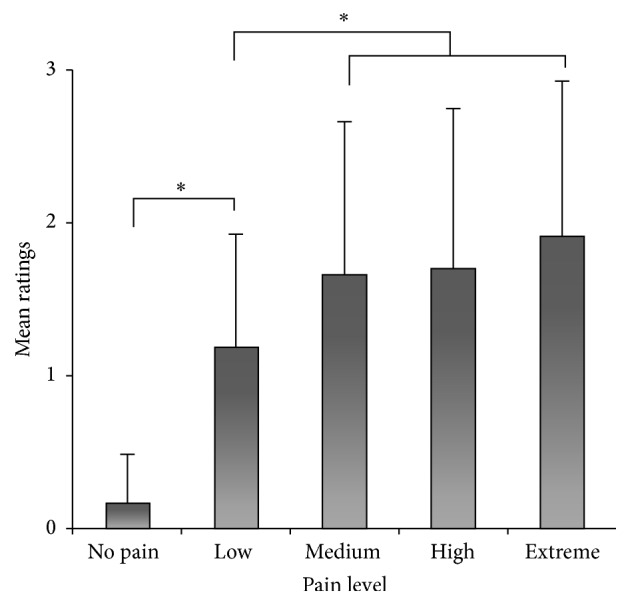
Figure 2.

Preschoolers' mean pain ratings attributed to the different pain intensity levels for visual stimuli depicting faces showing expressions of pain or neutral expressions. Error bars represent 1 SD. Significant differences (P < 0.005) are indicated by an asterisk.
