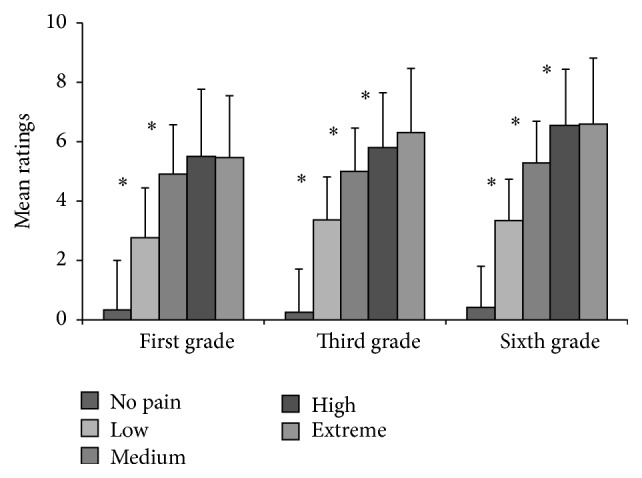
Figure 3.

School-aged participants' mean pain ratings attributed to the different pain intensity levels for visual stimuli depicting faces showing expressions of pain or neutral expressions according to age group. Error bars represent 1 SD. Significant differences (P < 0.005) are indicated by an asterisk.
