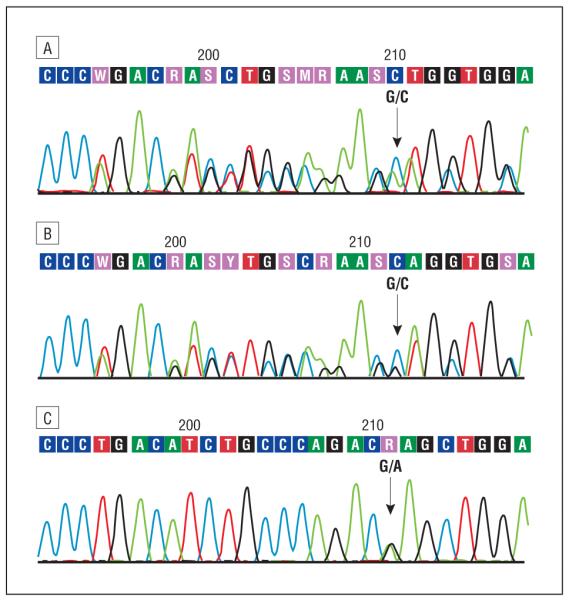
Figure 3.

Sequencing analysis of SCO2. A, Representative electropherogram of the DNA (sense strand) from the patient showing the compound heterozygous mutations c.1541G A (p.E140K) and a 12–base pair (bp) deletion at c.1519-1530. B, Representative electropherogram of the DNA (sense strand) from the patient’s mother showing the deletion (12 bp at c.1519-1530) in heterozygosity, without the p.E140K mutation. C, Representative electropherogram of the DNA (sense strand) from the patient’s father showing the heterozygous p.E140K mutation.
