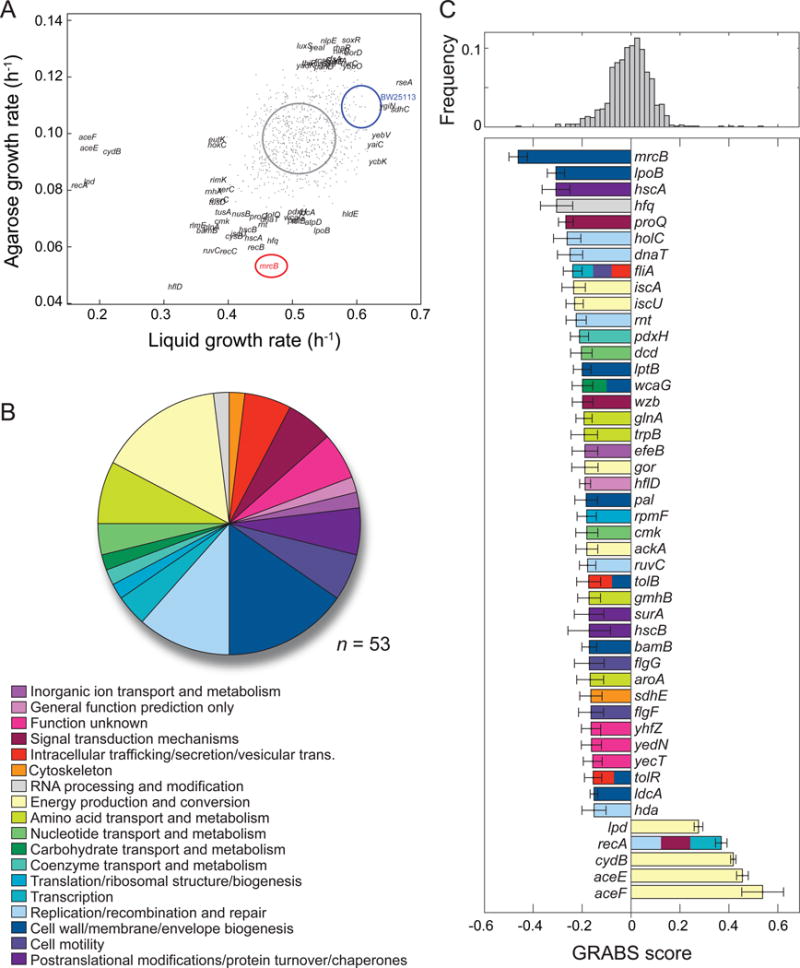
Figure 2. Cell-stiffness modulators encompass a large range of cellular functions.

A) Maximal growth rates in liquid and agarose. Blue and red ovals represent the mean growth rates ± one standard deviation for BW25113 and ΔmrcB, respectively (n ≥ 5 independent experiments); the gray oval represents the distribution of values for the Keio collection.
B) The 46 genes with GRABS score < −0.15 (n = 41) or > 0.3 (n = 5) come from 18 Clusters of Orthologous Groups (COGs). Several genes (ΔrecA, ΔtolR, ΔtolB, ΔwcaG, ΔfliA) are assigned to two or more orthologous groups, which gives rise to n = 53 total assignments.
C) Top: distribution of GRABS scores. Bottom: GRABS hits in (B). The average GRABS score and standard deviation across ≥ 6 replicates from multiple independent experiments are shown. Genes are colored according to their COG assignment. Genes with ≥ 2 COG assignments are colored accordingly. E. coli BW25113 has a GRABS score of 0 by definition.
