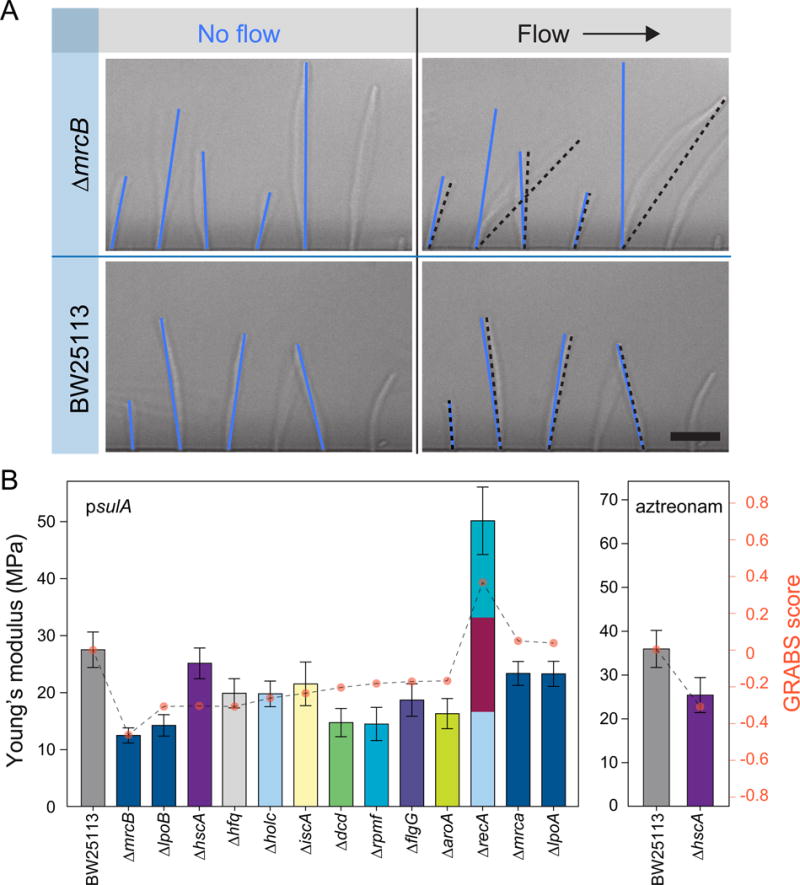
Figure 3. Microfluidic bending assay and elongation rate measurements of embedded cells yield relative stiffness measurements consistent with GRABS scores.

A) Representative images of filamentous wild-type cells and ΔmrcB cells in a microfluidic cell-bending device. Blue and black lines indicate the configuration of cells in the absence and presence of fluid flow, respectively. Deflection was measured as the difference between the position of the cell tip in the flow direction in the absence and presence of fluid flow. Scale bar: 10 μm.
B) Young’s moduli for sulA-induced (left) and aztreonam-treated (right) cells were determined by fitting deflection data (Extended Experimental Procedures) from a microfluidic-based bending assay. Error bars indicate 95% confidence interval to the fit (Extended Experimental Procedures). Data are colored according to each gene’s assignment to Clusters of Orthologous Groups, as in Figure 2B (n ≥ 130 cells, two independent experiments).
