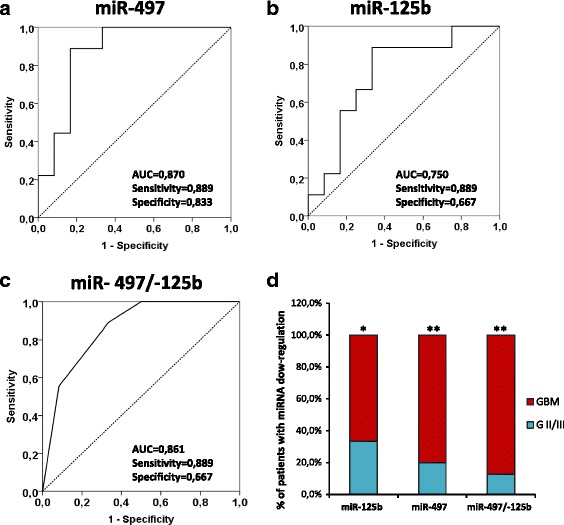
Fig. 2.

ROC curves of serum miR-125b and miR-497 to discriminate glioblastomas from lower grade gliomas. a-b ROC curve plotted for diagnostic potential and discriminatory accuracy of serum miR-497 and miR-125b to distinguish GBM from G II/III gliomas. The corresponding AUC, sensitivity and specificity values are reported. c ROC curve for the combined miR-497/-125b panel by a dummy variable with value 1 for patients with decrement of both miRNAs and 0 for the other combinations. d The histogram represents the distribution, between GBM and lower grade gliomas (G II/III), of the patients with miRNA expression levels lower than the cut-off values (0,00083 for miR-497 and 0,00065 for miR-125b). p-values (* = p ≤ 0,05; ** = ≤ 0,01) were determined using the Fisher’s exact test
